

Entrusted, Geomative carried out an induction electromagnetic (EM) investigation on a landfill site to identify the main areas of the landfill and provide a reliable scientific basis for the environmental investigation and restoration of the landfill.
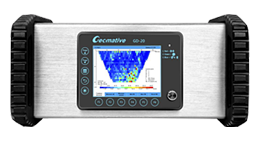
In this work, the GEM-2 multi-frequency electromagnetic detector was used for the induction electromagnetic survey. GEM-2 Induction Electromagnetic Instrument is light in equipment, high in sensitivity and easy to operate. It is suitable for many fields such as soil investigation and shallow geological exploration.
Firstly, conduct a feasibility test in the survey area to confirm the measurement parameters used in the later survey work. The EM test is carried out at the junction of a known landfill area and a non-landfill area, and a comparison test of multi-frequency data is carried out on one piece of data.
The feasibility test transceiver distance is 1.66m, the measurement frequency is 475Hz, 1525Hz, 5325Hz, 18325Hz and 63025Hz, and the emission magnetic moment is 3A·㎡. According to the depth formula and the local average comprehensive conductivity (the average value of the total conductivity of the whole area measured by GEM-2 is 0.827 S/m), the frequency relative depth table is obtained.
Table 1 Comparison table of measurement frequency and depth

At the same time, a high-density electrical resistivity (ERT) test was carried out on the EM measuring line. The results of the follow-up test found that the ERT sections with horizontal distances of 100-130m and 175-210m showed high resistivity anomalies, and the induced electromagnetic profiles showed low conductivity (high resistivity) anomalies (63025Hz, 18325Hz and 5325Hz curves, shaded part). The low-frequency data of 475Hz and 1525Hz are subject to more measurement errors and external interference, so it is not recommended to use this frequency for subsequent measurement work

Comparison of EM test line and ERT test line
Through the EM feasibility test, data in three frequency bands of 63025Hz, 18325Hz and 5325Hz were selected for analysis in the follow-up investigation, and the abnormal boundary was delineated.
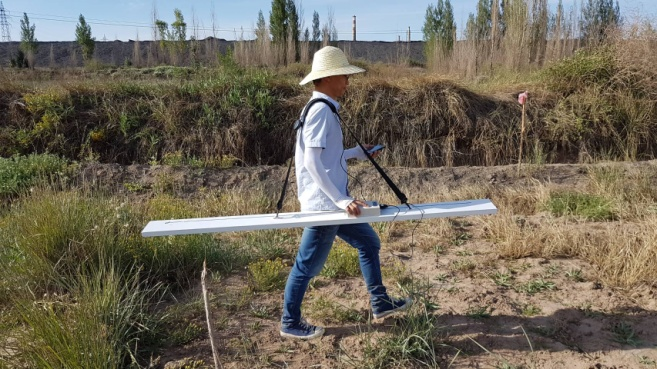
The EM detection is carried out by walking in the survey area with a manpower carrying an antenna. The walking speed is about 0.7~1.5 m/s, and with GPS positioning, five readings are recorded per second, and the apparent conductivity from the surface to about 8m below the ground is measured to collect data covering the entire survey area.
According to the detection results, the conductivity distribution diagram and magnetic susceptibility distribution diagram of different frequency bands are drawn (Fig. 3, Fig. 4, Fig. 5). Different high and low frequency values represent the measurement depth from shallow layer to deep layer, the lower the frequency, the deeper the depth, and different colors represent different conductivity, red represents high conductivity areas, and blue represents low conductivity areas.

EM conductivity and magnetic susceptibility chromatogram results (63025hz)

EM conductivity and magnetic susceptibility chromatogram results (18325hz)

EM conductivity and magnetic susceptibility chromatogram results (5325hz)
It can be seen from the multi-frequency profile that the lower the frequency, the higher the conductivity. According to the depth formula:
(1) The detection depth of 63025Hz is about 1.5~2m, and obvious garbage can be seen on the surface of the part with higher conductivity.
(2) The detection depth at 18325Hz is about 2~4m, and the part with higher conductivity is enlarged than that at 63025Hz. It is speculated that the buried area is further expanded.
(3) The detection depth of 5325Hz is about 4~8m, and the range of the high conductivity part is larger than the high conductivity range of 0~4m (red part), but the abnormal range of strong negative value of magnetic susceptibility is narrowed and concentrated, which is consistent with this investigation. The main gully topography of the area coincides with the landfill site.
According to the analysis of induction electromagnetic results, there may be a large area of landfill in the survey area. Combined with the 18325Hz, 2~4m conductivity distribution plan, the ERT survey line of the scattered landfill area (Figure 6) is laid out to provide guidance for further construction.

Induction electromagnetic results and layout of high-density electrical method measuring lines
There is no geo-membrane at the bottom of the survey area, which belongs to a large-scale informal landfill site. Through data collection, on-site survey, physical measurement and field feasibility test, our company uses induction electromagnetic method to conduct geophysical detection and identifies the main landfill of garbage. The buried area provides a basis for further high-density electrical measurement lines.

Industry-leading geophysical equipment and service provider supplier