

Entrusted, our company conducts an environmental geophysical survey of an industrial park. The industrial park covers an area of 0.48k㎡, and most of the enterprises in the park are electroplating factories. A large amount of oil pollutants were found in the surface water near the park, and it was suspected that the petroleum hydrocarbon pollution in the ground water of the park was discharged into the surface water. This survey used ground penetrating radar (GPR) and high-density resistivity (ERT) to detect the location, distribution and depth of DNAPL pollution in the survey area, and to describe the migration direction of oil pollution, providing a scientific basis for follow-up investigations, remediation, etc.
In this work, Geopro T400 ground penetrating radar was used for GPR survey, and GD-20 high density resistivity system was used for ERT measurement.
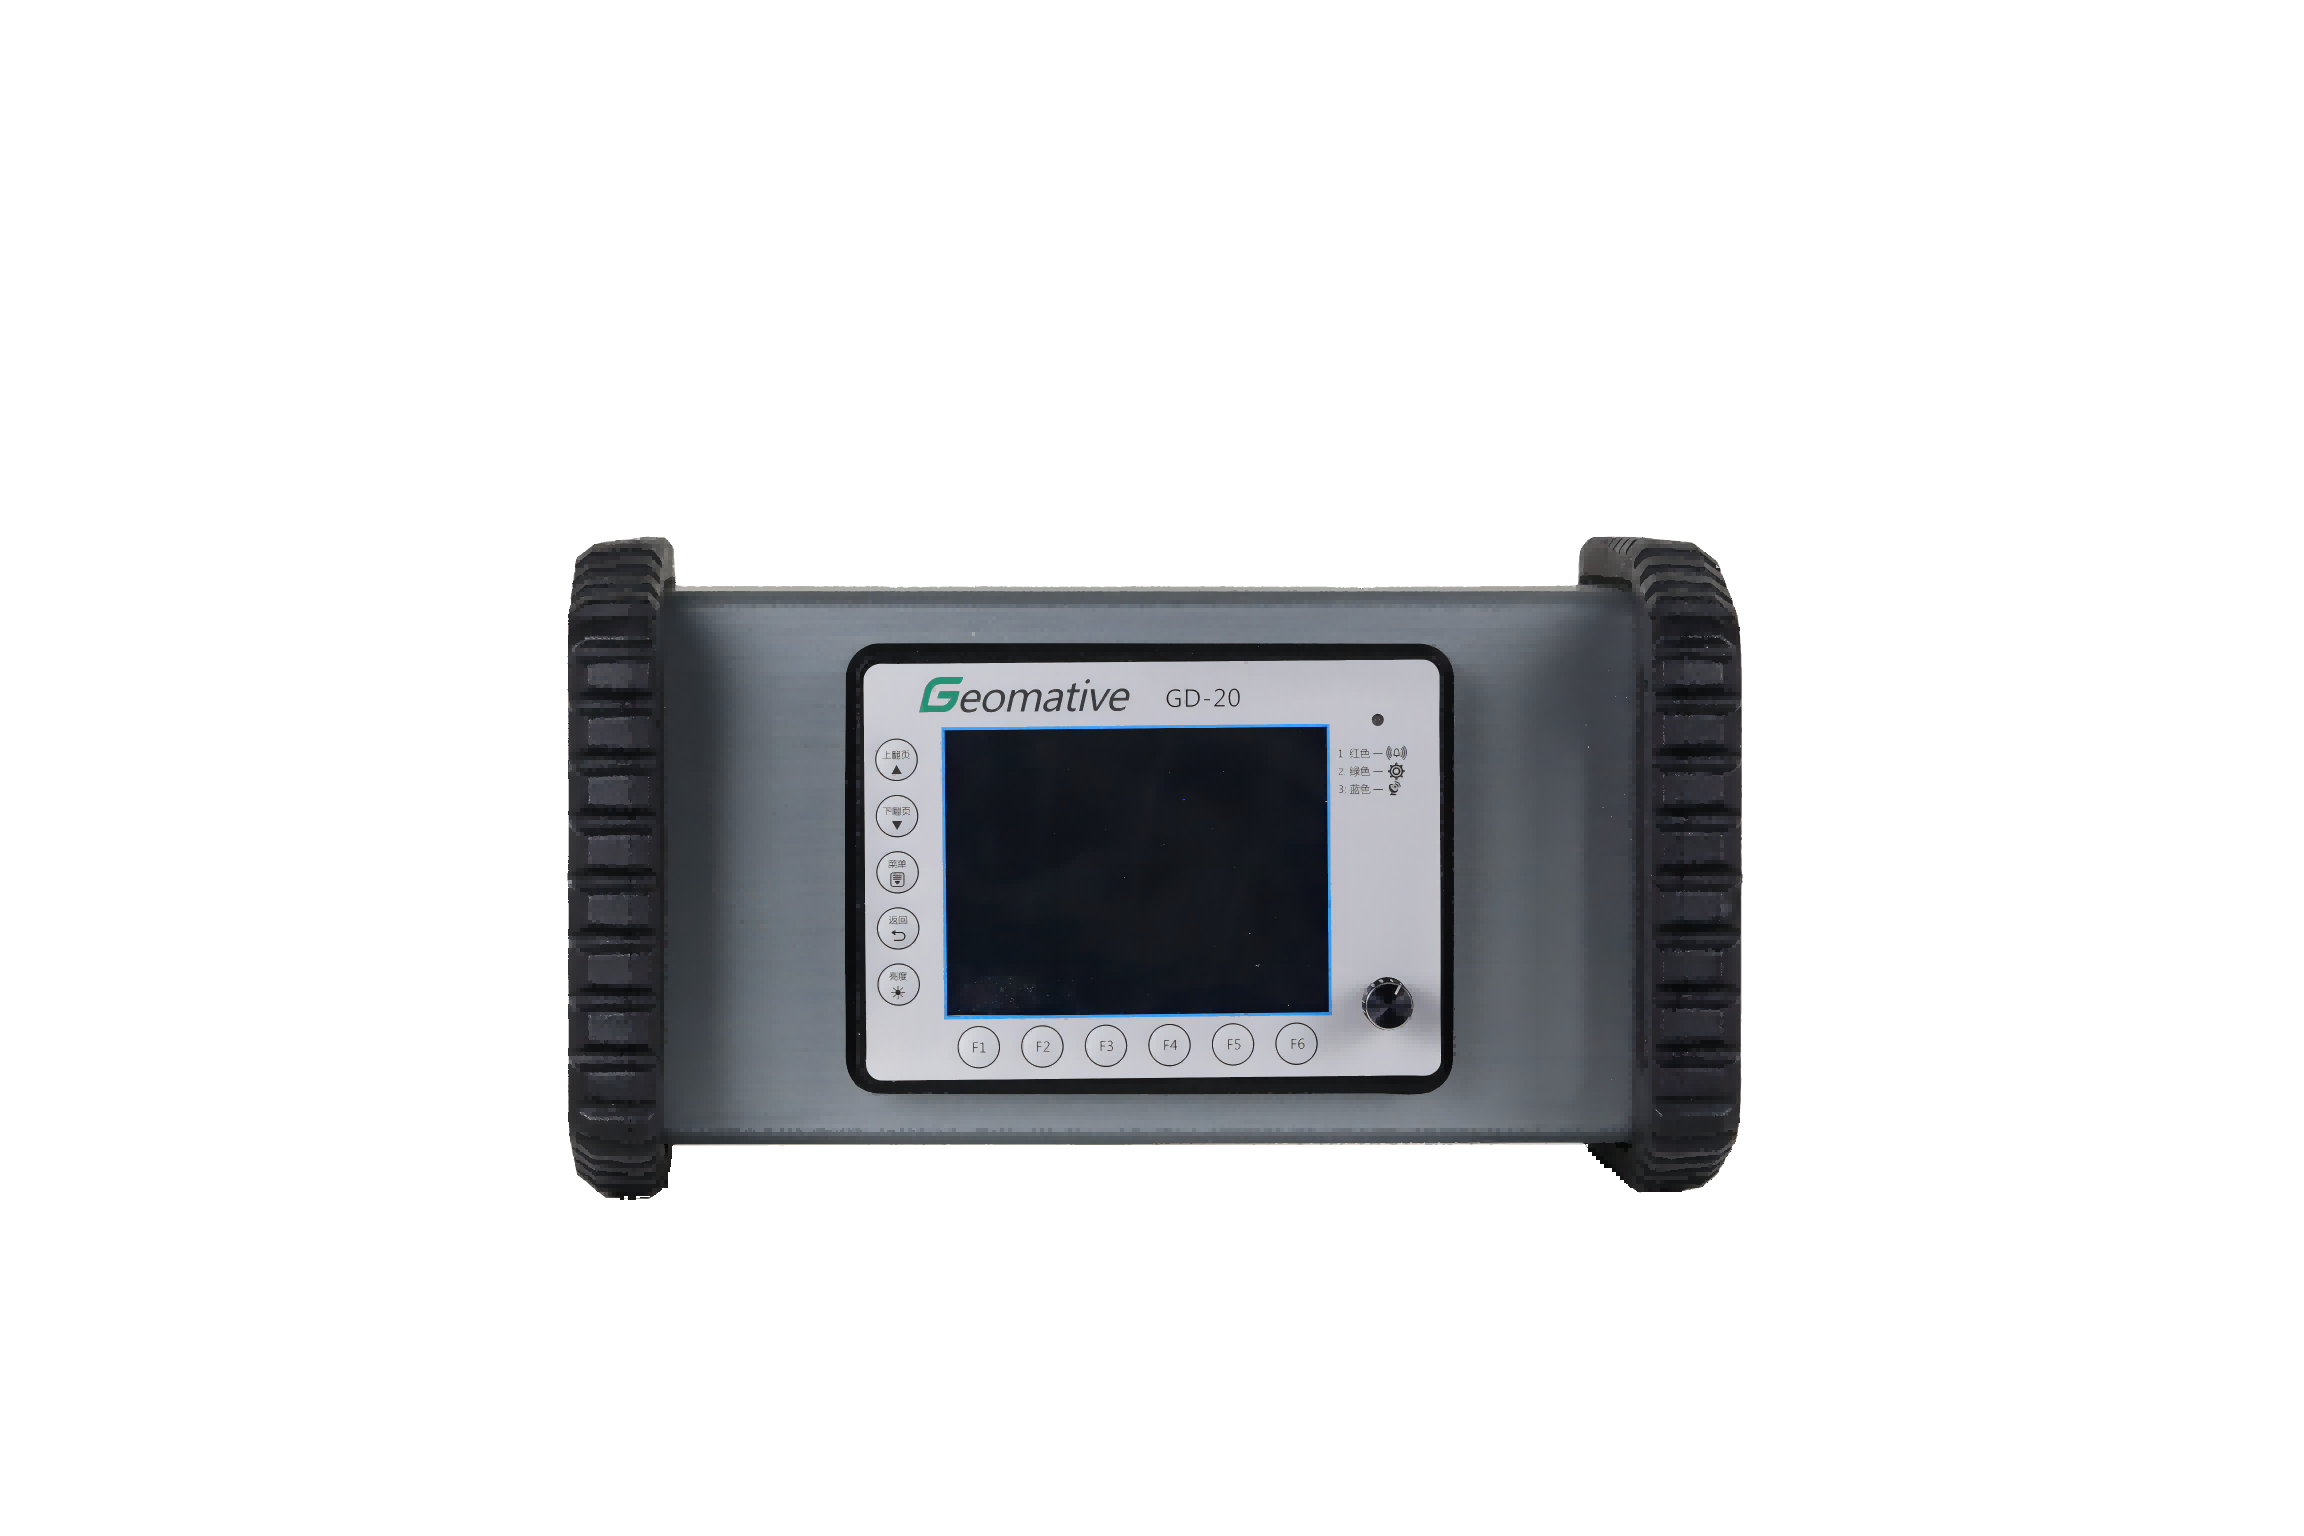
Geopro T400 is a portable, intelligent, high-performance, fully digital ground penetrating radar host, widely used in tunnel engineering, road engineering, water conservancy engineering, bridge engineering, civil engineering, military, archaeology and other fields. The GD-20 high-density resistivity system supports conventional electric depth sounding, and can also use two-dimensional and three-dimensional devices for cross-section testing, which can be used for self-electricity, apparent resistivity and induced electricity testing.

Figure 2 Geopro T400 ground penetrating radar diagram

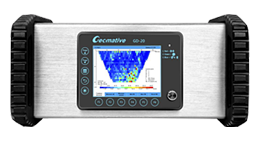
Figure 3 GD-20 high-density electrical resistivity tomography system diagram
There are many factories in operation in the survey area, and there are pipelines for electricity, water supply, drainage, gas, etc., so it is necessary to find out the conditions of underground pipelines and structures first. In this survey, the ground penetrating radar method was first used to scan to identify underground structures and possible sewage channels to supplement the interpretation of shallow anomalies. The line is laid out along with the ERT line, and a total of 11 lines are laid out

Figure 4 Layout of high-density survey lines in the survey area
The purpose of the ground penetrating radar in this work is to eliminate the underground pipelines and storage tanks in the park, and the survey results are mainly presented by the high-density resistivity method. When the soil or groundwater is polluted by oil, the resistivity tends to increase significantly, and there is a certain electrical difference with the surrounding substances. The resistivity distribution of the background measuring line in the survey area is within the normal range, and there is no abnormal high or low resistivity, so the resistivity value of the background measuring line can be used as a basis. If there is a phenomenon of extremely high resistance in the survey, it is very likely to be caused by oil pollution.
Taking ERT1, 2, 5, and 9 as examples, the analysis is as follows:
As shown in the figure below, the ERT1 survey line crosses the "suspected NAPL area". At a depth of about 5.5 m, there are two anomalous areas with large differences in electrical properties from the surrounding materials, which are presumed to be areas containing oil pollutants. The inference was verified by drilling samples.

Fig.5 Resistivity profile of ERT1 Wenner-Schlumberger array


Fig. 6 Sampling situation of boreholes in abnormal areas


Fig.7 Resistivity profile of ERT2, 5, 9 Wenner-Schlumberger array
In order to see the distribution of underground resistivity in the survey area more intuitively, a three-dimensional data volume is formed by three-dimensional space resistivity interpolation, and the resistivity plane of equal elevation is taken, and it is superimposed with the groundwater elevation to judge the space of pollutants distribution status. According to the topography and the direction of groundwater flow, it can be seen that pollutants mainly migrate from northwest to southeast, that is, they migrate from the park to the river bank along with the groundwater.

Figure 8 Schematic diagram of pollutant distribution and migration direction
This investigation has found out the core pollution area in the survey area, the movement path and area of pollutants. The area of the core polluted area is about 1260㎡, the pollutant distribution depth is about 4.5~8m, and the pollutants migrate from the park to the downstream river bank

Industry-leading geophysical equipments and service provider supplier