

nonaqueous phase liquids (NAPLs) generally cannot be mixed with water after entering the aquifer, but can occur in soil and groundwater as liquid and gas phases. Groundwater contaminated by NAPLs will pose a threat to the ecological environment and human health, so the environmental investigation of NAPLs contaminated sites is of great significance.
In general, the electrical conductivity of fresh DNAPL pollutants is far less than that of water, so it usually presents as relatively high resistivity anomalies. After long-term weathering, the electrical conductivity of organic pollutants will obviously increase (or decrease) with weathering degree and time. However, no matter whether it is weathered or not, there will be obvious electrical difference between it and surrounding rock in the underground medium.
Entrusted by client, we investigated the distribution range of soil and groundwater DNAPL pollution in a site, and explored the distribution range and depth of soil and groundwater pollution in the investigation area. This survey combined induction electromagnetic method (EM) and high density resistivity method (ERT), using geophysical technology to detect a large area of suspected pollution distribution.
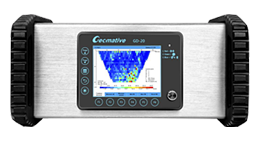
In this work, GEM-2 multi-frequency conductivity meter was used for induction electromagnetic survey, GD-20 high density resistivity system was used for high density resistivity measurement, and the information of measuring points was collected by RTK.
GEM-2 induction electromagnetic instrument equipment is light, sensitive, easy to operate, suitable for soil survey, shallow geological exploration and other fields. The GD-20 high density resistivity system supports conventional electrical sounding, as well as two - and three-dimensional sections for self-electric, apparent resistivity and IP measurements.

Figure 2 GEM-2 induction electromagnetic meter


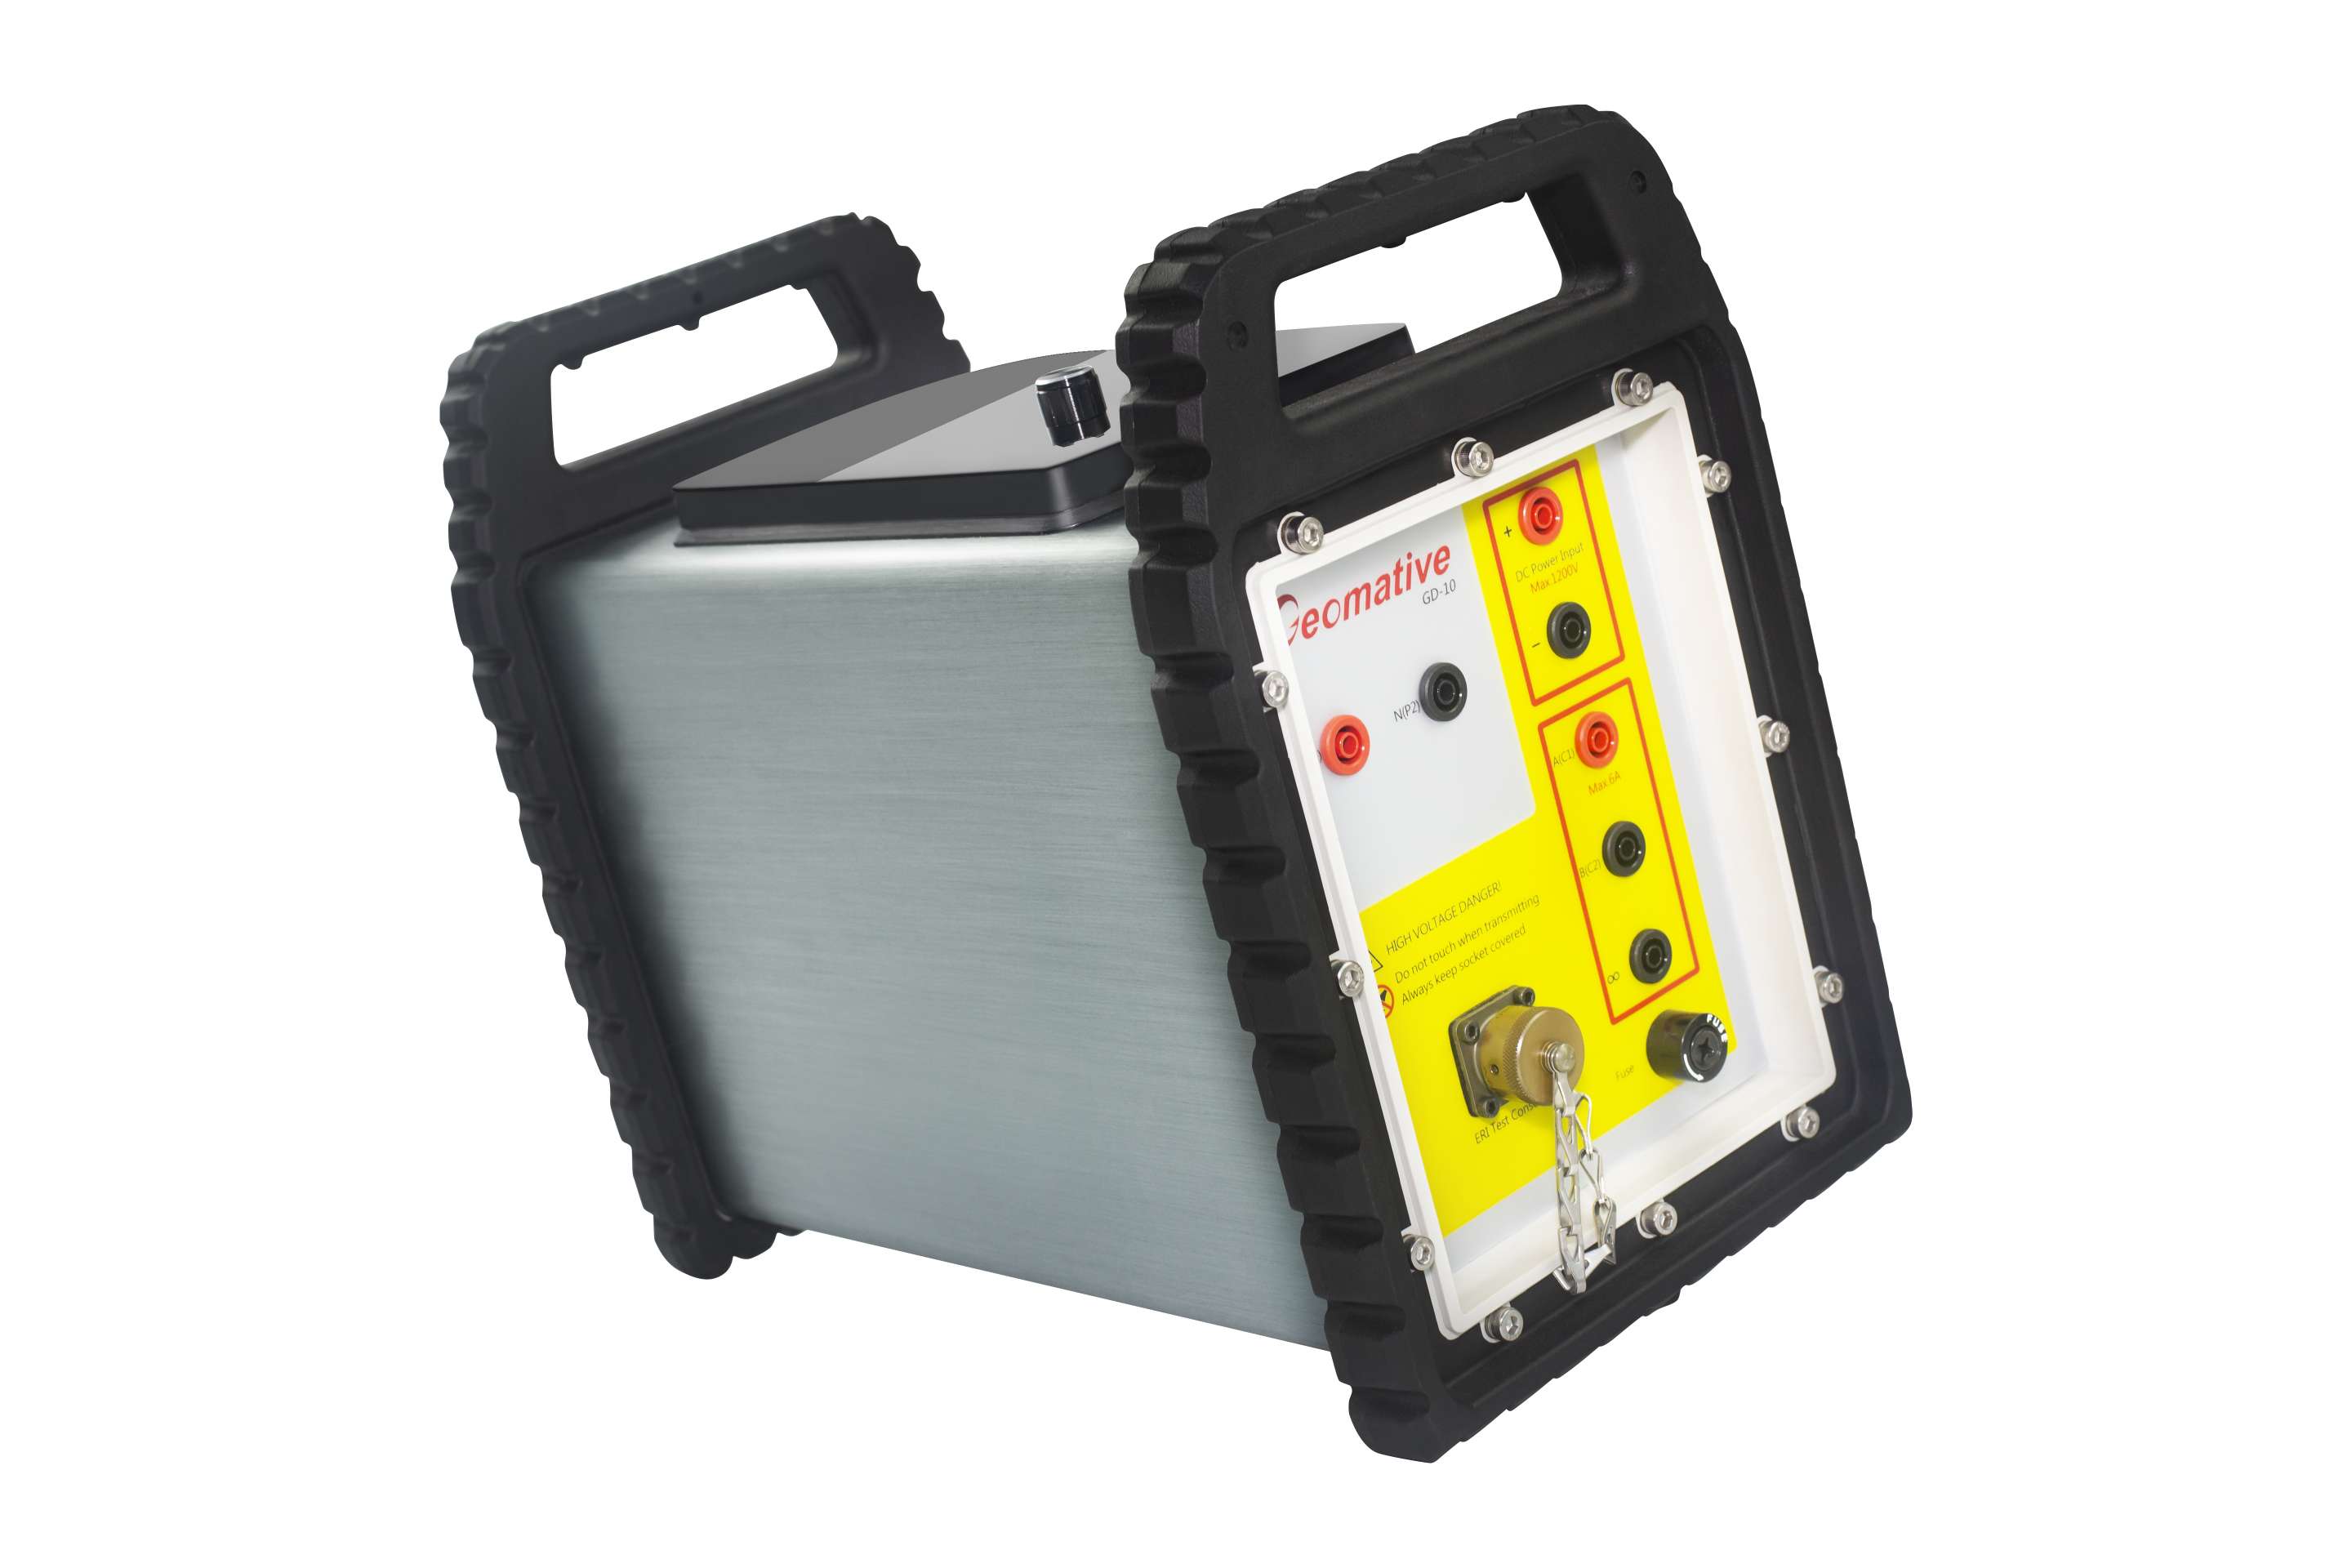
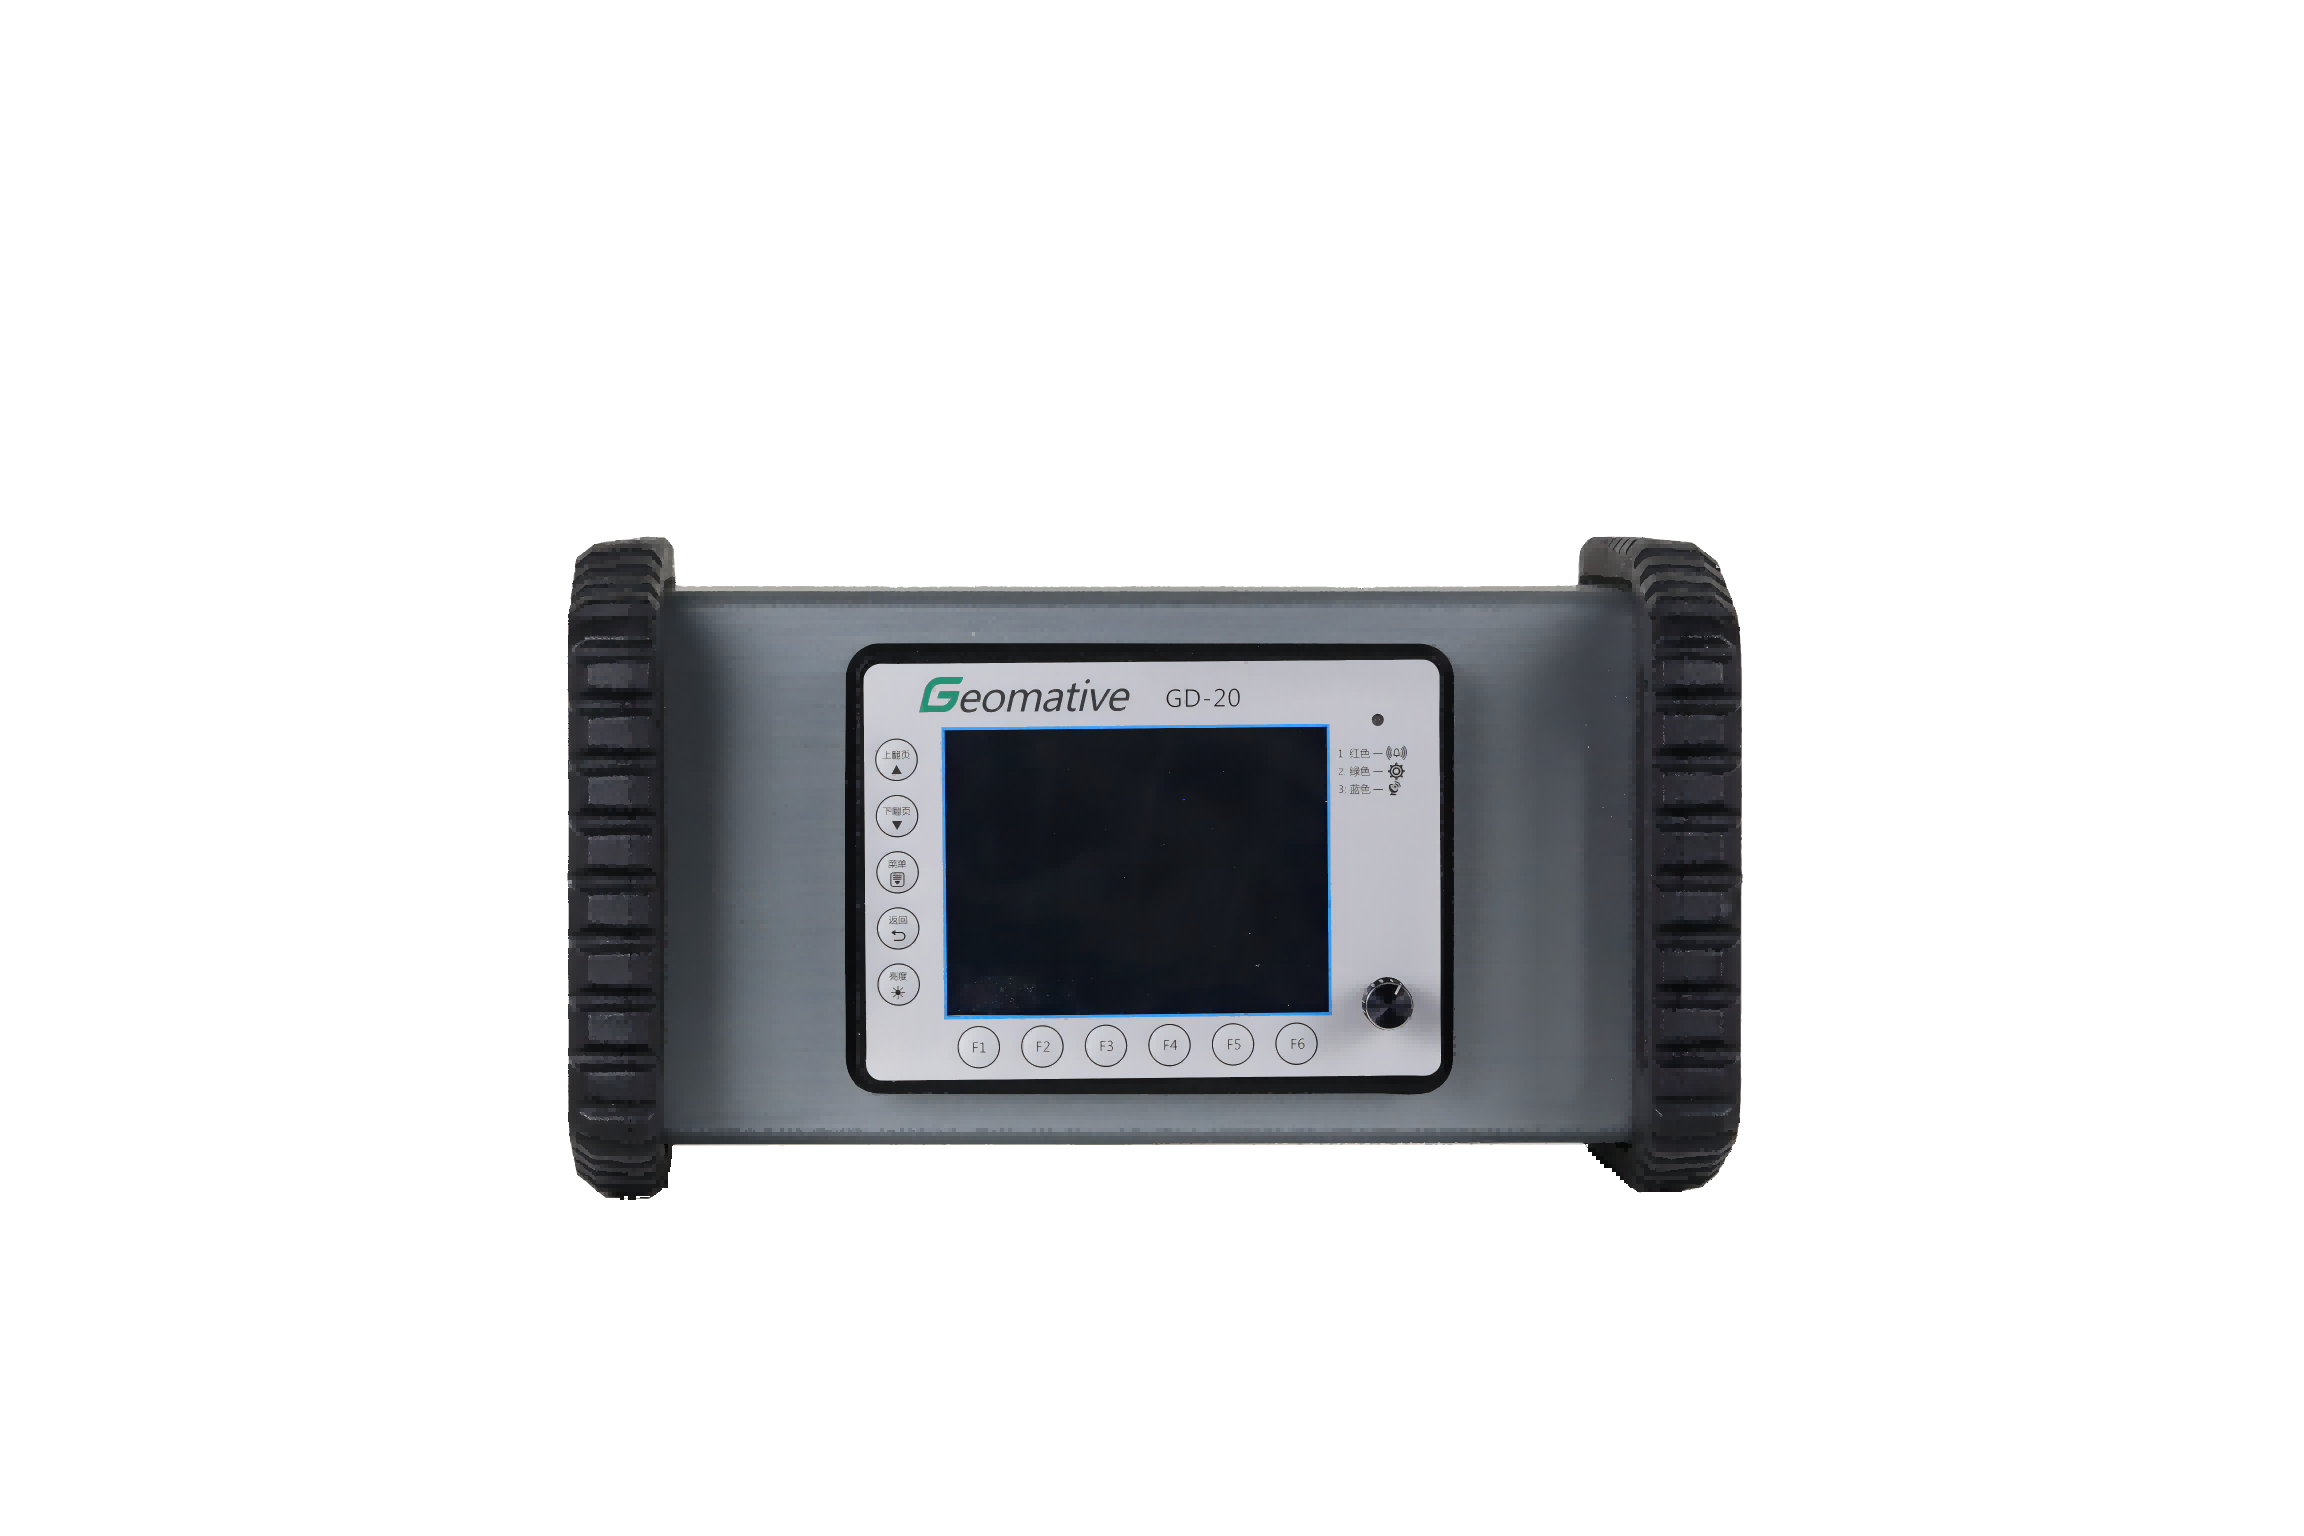
Figure 3. GD-20 high density resistivity system diagram
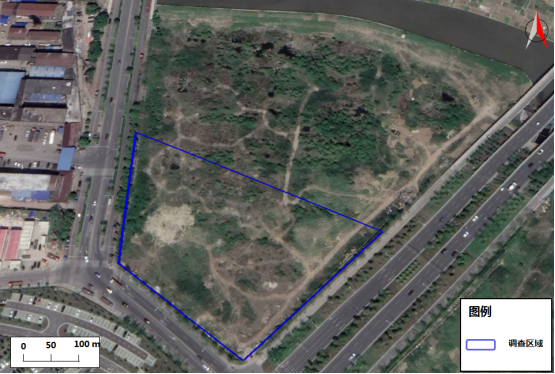
The original factory has been abandoned and demolished for many years. The investigation site is flat, but the vegetation is thick. In order to obtain better data, the area suitable for EM survey was selected for investigation (yellow area in FIG. 4), and the scope of high potential pollution was quickly identified. Due to the limited EM detection depth, ERT was further used to detect the depth and range of pollution. ERT survey lines were laid on the basis of EM detection results and field terrain conditions, with a total of 7 survey lines (as shown in the red solid line in Figure 4). Wenner-Schlumberger Array method was adopted for the test.

FIG. 4 EM detection area and ERT survey line layout in the investigation area
Analysis of Results
In order to fully understand the stratification of the site and the thickness of the aquifer, the site strata should be first explored before the site pollution investigation.

FIG. 5 Formation resistivity profile results
The resistivity of the site presents the electrical distribution law of "high - low - high" change. Based on the field data and resistivity characteristics of the medium, it is speculated that the first layer is backfill soil with relatively high resistivity, and there may be rubble, construction waste, etc. The second layer is a submersible aquifer, the underground water depth is about 2.3 m; The third layer is clay or silty clay. The resistivity of the uncontaminated groundwater is about 30 Ohm·m. The resistivity of the second layer reflects the extremely low resistivity of the groundwater at the site, and it is speculated that the groundwater is in a state of contamination.
Analysis of induction electromagnetic method
In order to see the electrical conductivity of the survey area more directly, all EM results were projected onto the topographic map to correspond to the location of the survey area, as shown in Figure 6 below. As can be seen from the projection figure, the pollution potential area of the investigation area is mainly distributed in the northwest and southwest corners of the investigation area, and the northwest corner is presumed to be the heavily polluted area. (The red series in the figure represents the high conductivity range (low resistivity), while the blue-purple series belongs to the low conductivity range)

FIG. 6 Comprehensive conductivity projection of the test area
Analysis of high density resistivity method
The high-density resistivity method has the advantages of high resolution, high accuracy and deep detection depth. It is suitable for detecting all kinds of soil and groundwater pollution and hydrogeological distribution. The processed electrical stratigraphic map can completely present the characteristics of underground environment.
Taking ERT6 as an example, at the horizontal position of 0-64 m and the average depth of 0-8.3 m, there are relatively low resistance abnormal areas with resistivity lower than 2 Ohm·m, and there are relatively high resistance abnormal areas in deeper depths. Many of the anomalies are presumed to be pollution potential areas. The high resistivity anomalies are distributed below the low resistivity anomalies, indicating that the underlying DNAPL pollutants have not been affected by weathering.

FIG. 7 Two-dimensional resistivity profile of ERT6 line
In order to see the underground resistivity distribution in the survey area more directly, the resistivity results of the high density resistivity method in the survey area were composed into a slicing diagram to obtain the comprehensive high density resistivity distribution results of the survey area, and the slicing results were displayed from different angles.


FIG. 8 Three-dimensional grid diagram of resistivity profile in the investigation area
Excluding the surface backfill construction waste, there are many abnormal resistance areas in the investigation area, with an average depth of 0-10 m, which is the pollution collection area. The local resistivity value is less than 1 Ohm·m, which is speculated to be a heavily polluted area. In addition, there is a possibility that contamination will continue to seep down (resistance spreading abnormally downward, unsealed).

FIG. 9 Distribution range of pollution potential area in the investigation area
The pollution potential area is mainly distributed in the northwest and southwest of the investigation area, and the northwest is the heavily polluted area. The low-resistivity abnormal area presented by ERT is basically consistent with the high-conductivity abnormal area presented by induction electromagnetic method, which mutually verifies the measurement results.
Through non-destructive means, geophysical exploration can obtain a large range of continuous underground electrical profile data, understand the extent and depth of pollution distribution, and increase the field information from the original point information to the surface and body, which is complementary to traditional drilling sampling.

Industry-leading geophysical equipments and service provider supplier