

Purpose of the survey
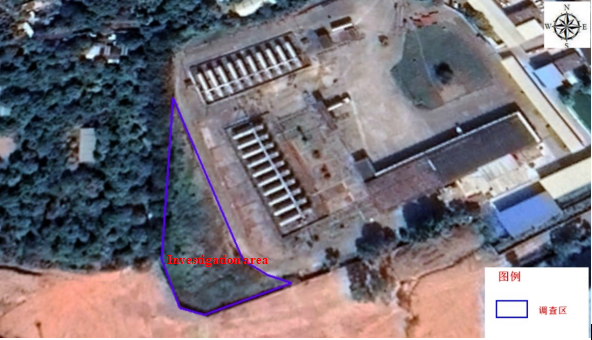
The purpose of this investigation is for geophysical surveys on the field area to detect the landfill distribution range and volume of waste molecular sieve in the field area.
The scope of the survey is shown in the blue area in Figure 1-1 below.
Project Status
To complete 3 ERT cables measurement. We use GPS positioning for ERT work and collect the data of the area. And we use the ERT method to detect the distribution of waste in the survey area
In order to find out the distribution of waste in the investigation area, we use ERT method and setup 3 measurement lines. The figure and chart as follow

Figure 2-1 ERT measurement lines
Chart 2-1 ERT measurement lines details
| Method | Lines No | Cable length(m) | Electrode spacing (m) | Array |
| ERT | ERT1 | 69 | 1 | Wenner, Schlumberger |
ERT2 | 69 | 1 | Wenner, Schlumberger | |
ERT3 | 69 | 1 | Wenner, Schlumberger |
ERT profiling results
According to the results, the molecular sieve has very poor conductivity, but the resistivity is different after mixing with other soils. In order to identify anomalies, we should analyze the shallow soil distribution and low resistance of rock core and high resistance characteristics.

Figure 5-1 ERT1

Figure 5-2 ERT2
In ERT1, two relatively high-resistance abnormalities (1) and (2) are found, the resistivity is higher than 1000 ohm. In the relatively low-resistance abnormal areas (3) and (4), the resistivity is less than 35 ohm. In ERT2, three relatively low-resistance abnormalities (1), (2) and (3) are found, the resistivity is less than 30 ohm. In the high-resistance abnormal area (4), resistivity is higher than 600 ohm.

Figure 5-3 ERT3
In ERT3, there are 2 layers. The first layer is a continuous high resistance layer, the resistivity is between 600-2500 Ohm-m. The second layer is a relatively low-resistance anomaly area (1), it is between 16-50 ohm-m.
ERT fence diagram
In addition to better visualization of the underground waste distribution, the fence diagram is more advantageous to show different views of the anomaly area.


Figure 5-4 Fence diagram 1

Figure 5-4 Fence diagram 2

Figure 5-4 Fence diagram 3
Landfill assessment
3D model of the resistivity result is shown below.

Figure 5-7a Test line 3D model (50 ohm-m distribution of waste)

Figure 5-7b Test line 3D model (450 ohm-m distribution of waste)


![]() Figure 5-8 ERT profile chart
Figure 5-8 ERT profile chart
The survey results are processed with rockwork software to evaluate the area and volume of the molecular sieve field

Figure 5-9 Abnormal distribution results
1.According to the measurement results, the molecular sieve distribution is messy in this field, and it is not landfill at the same time. Combined with the results of the resistance image profile method, the buried depth is not deep. There are two types of burial depth, 3.7-4.6 meters and 2.6-3.0 meters.
2. Combined with the rockwork map, we can see the buried area of the molecular sieve backfill in the field is about 187 square meters, and the volume is about 861 cubic meters.
3. Inverse Distance / Anisotropic grid method, we can calculate the volume of unknown buried objects is about 2000 cubic meters.
4. Although the molecular sieve conductivity is extremely poor, unless it is a pure phase molecular sieve distribution, it may contain muddy materials or heavy metal soil when mixed with different soils, and its resistivity may appear relatively low resistance.
5. According to the resistivity morphology to see whether the formation is disturbed. this investigation judges whether the stratum is disturbed according to the resistivity morphology, this phenomenon is probably caused by the behavior of burial, and the resistivity distribution is discontinuous.After that, to estimate the location and depth of abnormal areas with resistivity.
6. The main purpose of the environmental geophysical method is to have more on-site information, it does not mean to replace the traditional detection technology, more on-site information is better to verify the accuracy and timeliness of geophysical methods, which is complementary to traditional drilling sampling.

Industry-leading geophysical equipment and service provider supplier