

subMAP Geophysical Services Sdn Bhd (subMAP) was commissioned by Jabatan Alam Sekitar Cawangan Gebeng, Kuantan, Pahang (the Client) to conduct an electrical resistivity tomography (ERT) survey to map suspected unknown schedule waste at Greenverse Sdn Bhd, Gebeng, Kuantan. The Client received a complaint that there was an unknown schedule waste dumped under Warehouse No 2 at the premise. As the warehouse had concrete cement flooring, it would not be possible to confirm the existence of buried schedule waste without tearing the floor apart. The Client therefore decided to conduct an ERT survey to obtain preliminary information of the subsurface under the warehouse. Based on the findings of the ERT, the Client will then decide on the next course of action. Prior to the ERT survey, the Client has conducted random sampling around the warehouse and found oil sludge.
The ERT field survey was conducted on the 13 April, 2022 and was completed on the same day
ERT survey
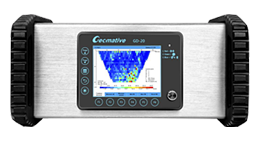
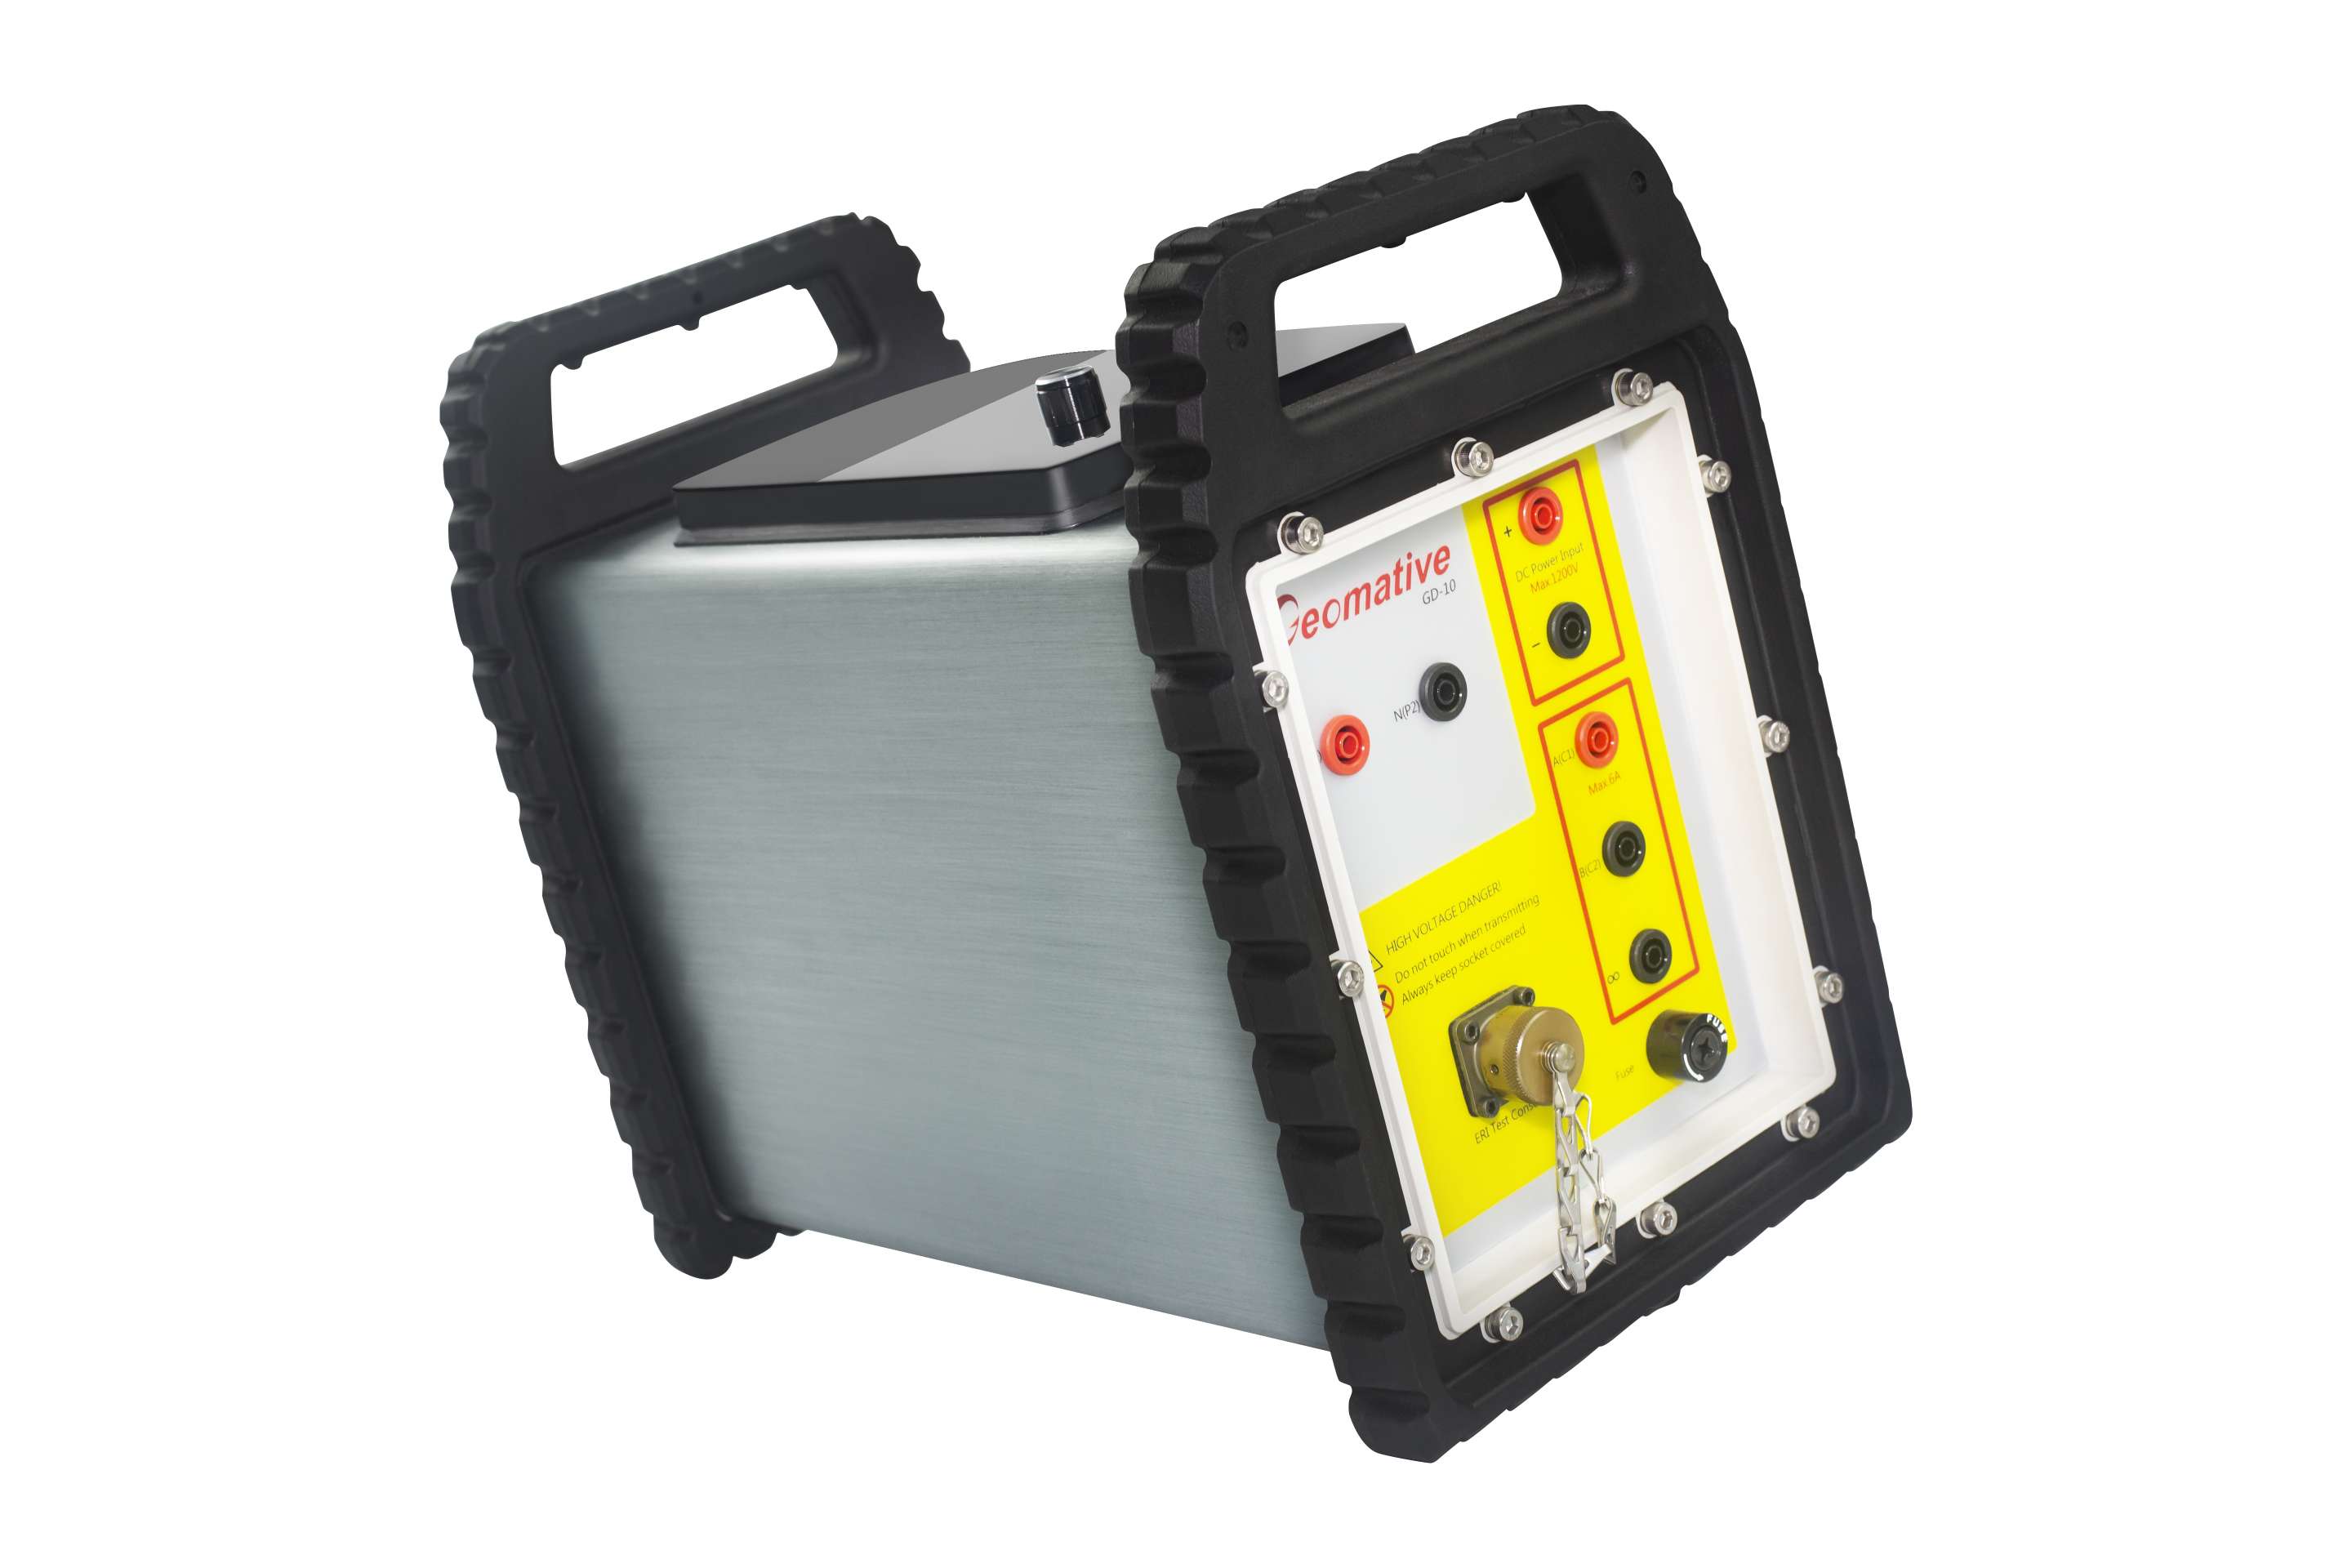
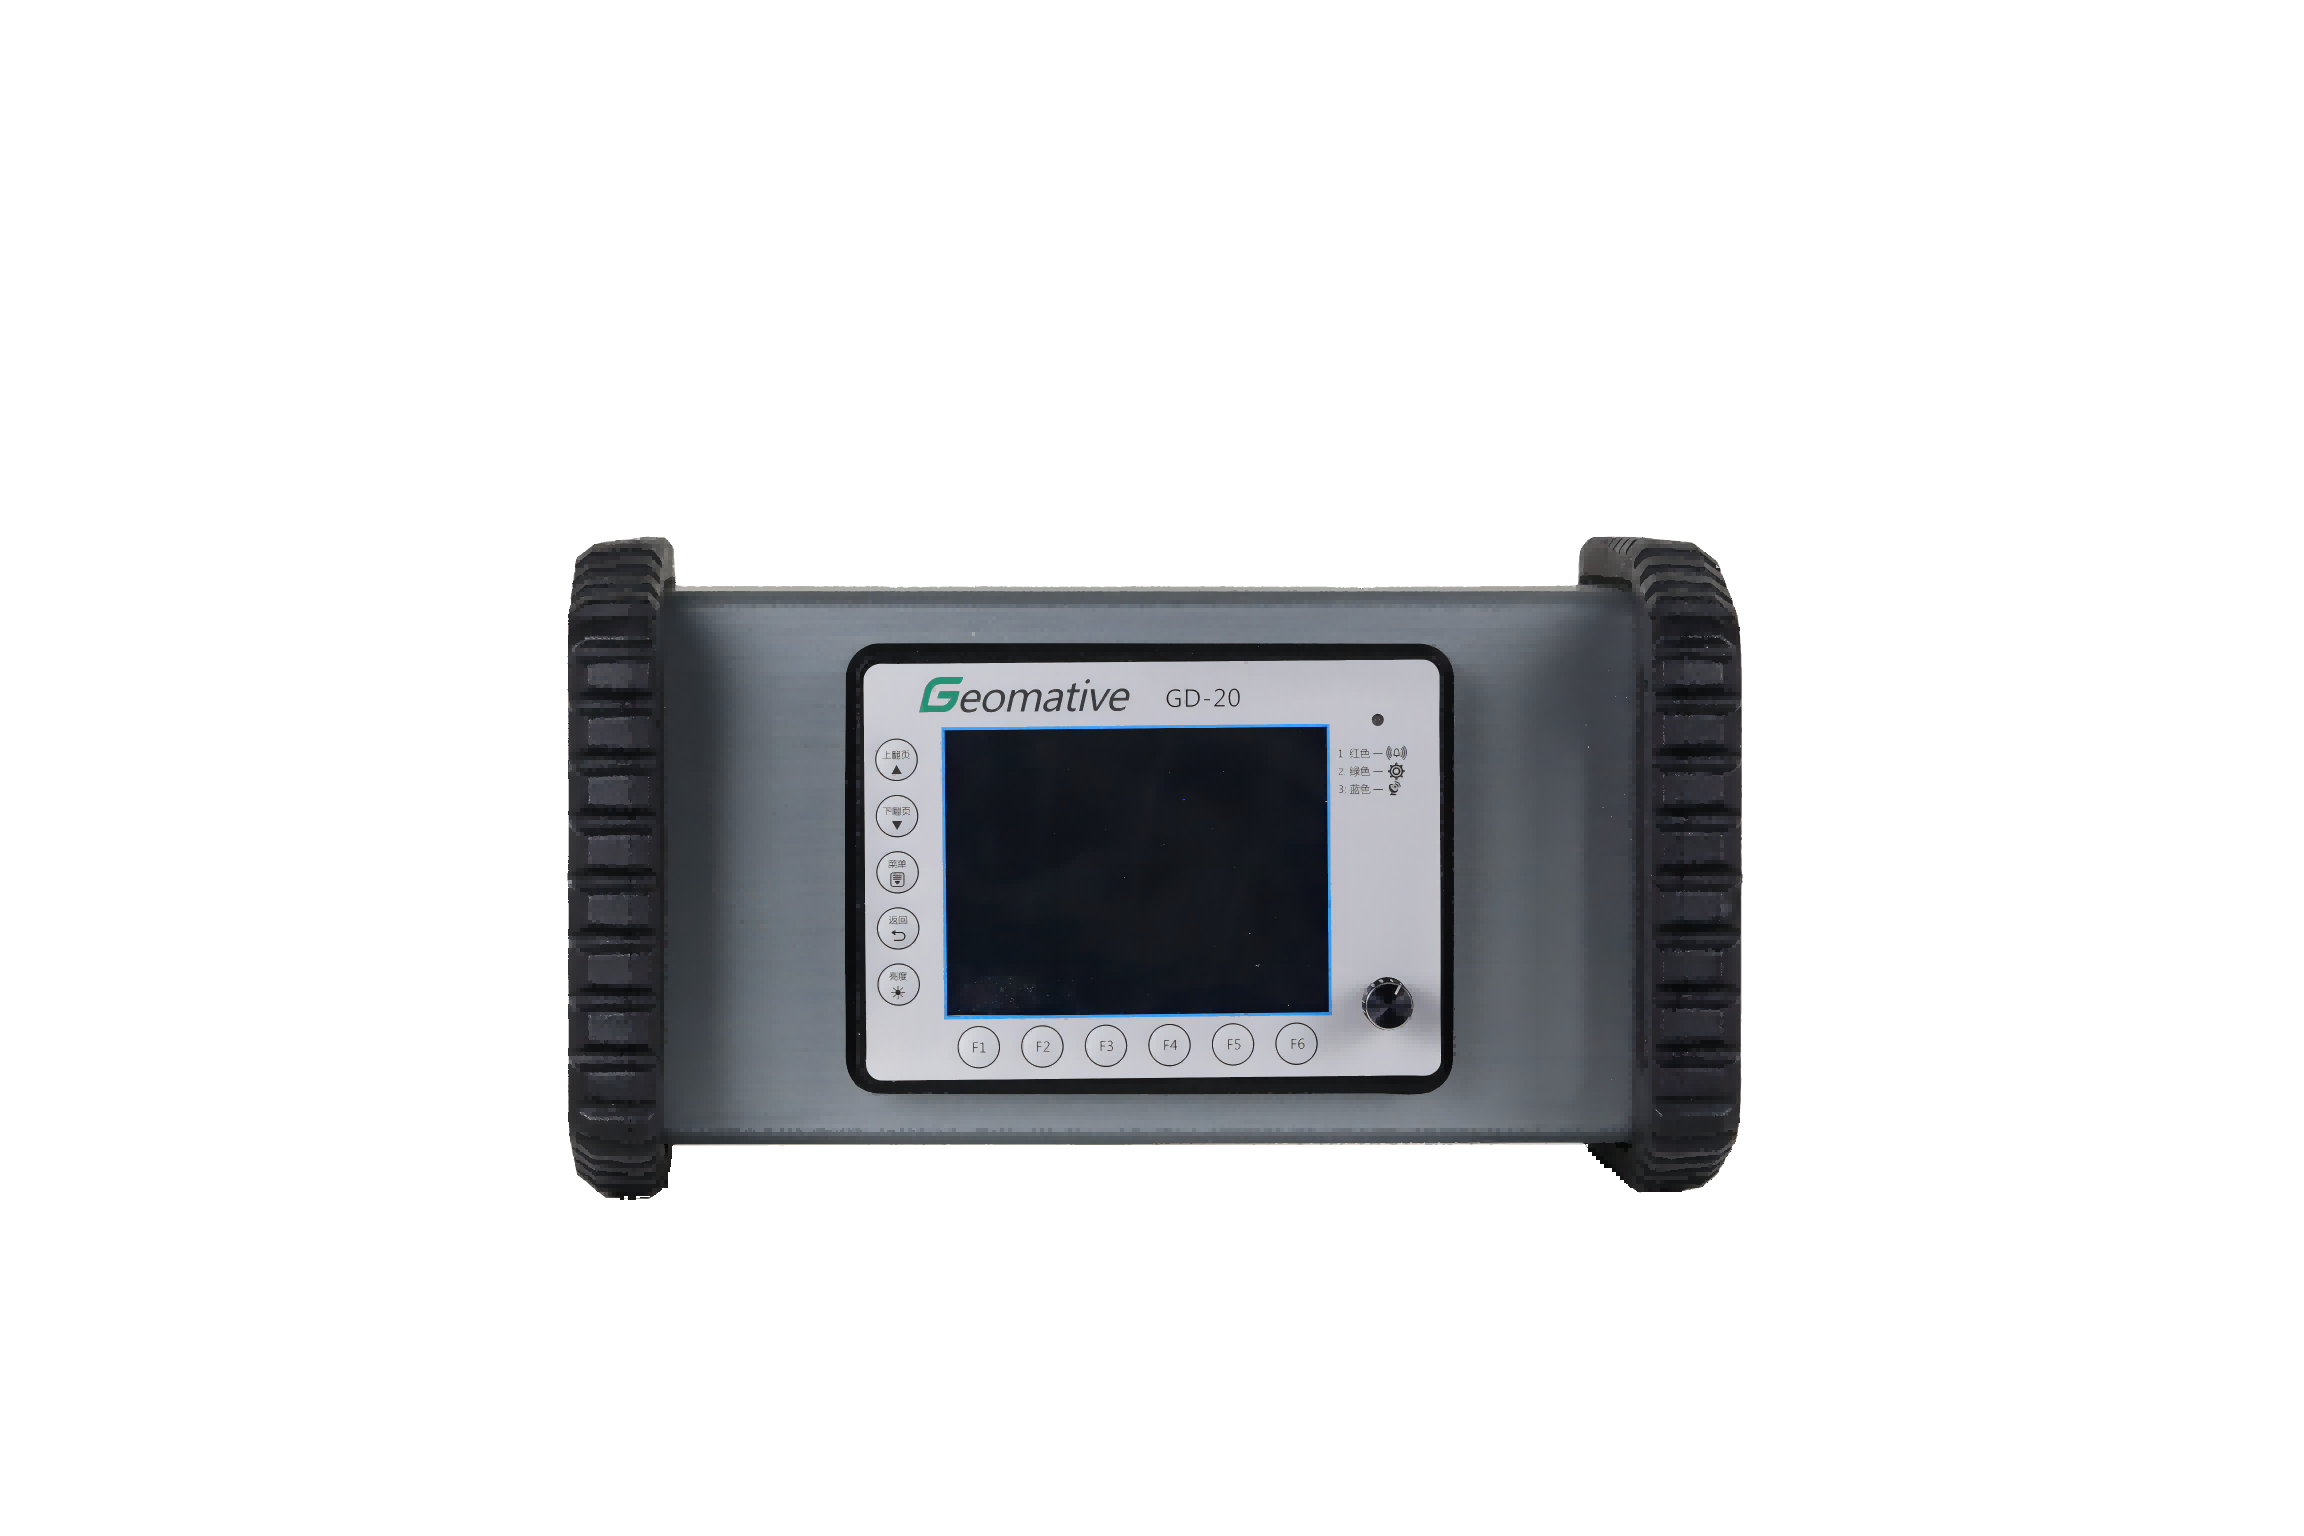
The survey was carried out using the GEOMATIVE GD-20 DC Geoelectrical system. This is a multi-channel system, capable of measuring of up to a maximum of 12-channels per current injection. The survey was carried out using both the Wenner-Schlumberger protocols with 20-electrodes configuration.
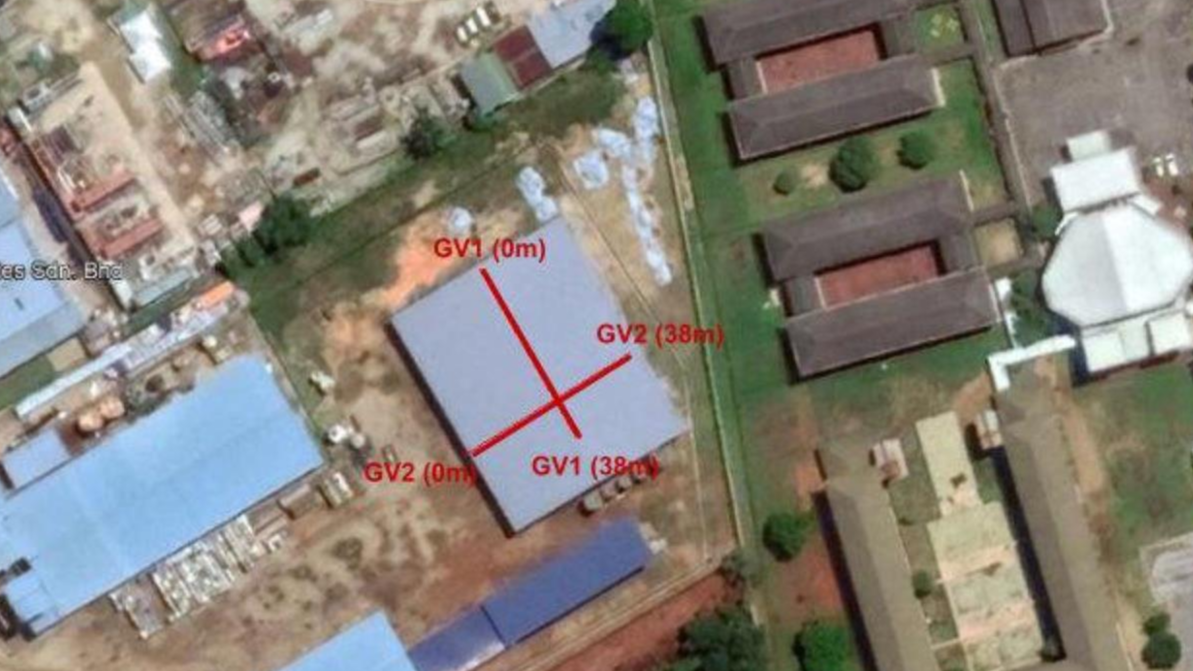
The electrode interval was 2m, giving an effective length of 38m for each line. Two (2) lines were surveyed and their layouts are shown in Figure 1.
Small holes were drilled into the concrete cement floor to plant the electrodes. This is to ensure good contact between the electrodes and the ground.
2D-inversion
All data acquired by the GEOMATIVE GD-20 system were transferred directly to the laptop via the GEOMATIVE Studio software. This software was also used to filter out bad data points prior to putting the data through the inversion process. Only good quality data were accepted for inversion.
The data were then exported to RES2DINV format, the software used to invert the data to produce subsurface models. RES2DINV have several other options to ensure only good quality data were passed through for inversion. The robust constraint was selected for the inversion model as it was suspected that schedule waste would have been buried in a confined space. By running the robust inversion, the boundary of the confined space would be mapped more accurately


The results of the ERT survey are shown in Figure 2. The corresponding resistivity block models is shown in Figure 3. The block models are meant to show the influence of the individual cells on the inverted range of resistivity values. Detailed descriptions of the results for each line are described below.
Line GV1
Line GV1 runs along the length of Warehouse No 2 and is located almost in the middle. The layout of this line was discussed with the Client as they thought there was a strong possibility that the unknown schedule waste would have been dumped somewhere in the middle of the warehouse.
The subsurface resistivity structure is shown in Figure 2 (top). The resistivity values range from as low as < 0.5 Ωm to > 75 Ωm. The extremely low resistivity values of < 0.5 Ωm are only confined to a depth of a few meters (Blocks A, B, C and D in Figure 2) below the ground surface. Except for Block C, all the other blocks have a consistent thickness of about 2.5m. Block C is slightly thicker, extending to about 4m. The almost similar thickness of the blocks together with the constant gaps of about 2m between the blocks seem to suggest the features are man-made. It is very likely that the blocks represent soil which has been removed (excavated) and replaced with some unknown materials with extremely low resistivity values. If it is the original soil, the resistivity values will not be that low.
Underlying these blocks are typical soil materials with > 25 Ωm. It could likely be mixture of clay and sand materials. As the depth of investigation is very shallow (about 8m), no bedrock was encountered. Bedrock would have typically resistivity values of > 1000 Ωm.
Line GV2
Line GV2 runs along the breadth of the warehouse and is perpendicular to Line GV1. It crosses Line GV1 almost at the center of the line.
The subsurface resistivity structure (Figure 2, bottom) shows very low resistivity values of < 2 Ωm throughout the whole profiles. The first half of the profile is dominated by low resistivity of < 0.1 Ωm. Beyond this distance, the resistivity values is split into two distinct layers. The upper layer with thickness of about 3m and having extremely low resistivity values of < 0.1 Ωm. Underlying this layer, the resistivity reaches up to about 2 Ωm.
The features observed on this line bear no resemblance to Line GV2. This would suggest that Line GV2 is actually running parallel to the features (blocks) observed on Line GV1. It would be very likely that it is running along and parallel to Block D. Thus, it does not pick-up any 3other features, other than the low resistivity values. However, the range of resistivity values is very similar to that observed in Block D of Line GV1.


The ERT survey had identified four significant blocks which are likely man-made features on Line GV1. These are indications of soil materials which has been removed (excavated) and replaced with some other unknown materials with extremely low resistivity values. These blocks warrant further investigation by the Client. It is recommended that the Client proceed with soil sampling via drilling to confirm the type of materials filling the man-made features.
Industry-leading geophysical equipment and service provider supplier