

The XXX factory covers an area of14450m2, mainly engaged in pilot testing of new products, refining of optical brighteners and production of pharmaceutical intermediates and electronic chemical products. In the third quarter of 2018, the factory was demolished as a whole, no production operations were in progress, and the original buildings were all cleared.
Due to the simple production process and relatively weak awareness of environmental protection in the early stage of XXX, the soil and groundwater in and around the original plant in XXX may be polluted by benzene series and chlorinated hydrocarbons to different degrees after decades of production of halogenations and ammoniation.
To this end, XXX factory implemented harmless treatment of ground storage (including construction waste) and remediation of contaminated soil and groundwater in the original factory. As a part of the work plan of the whole supplementary investigation, this environmental geophysical survey program aims to make clear the scope, distribution and pollution degree of soil and groundwater pollution, so as to provide reliable information for the later construction.
Purpose of Investigation and Evaluation
The main purpose of this environmental geophysical investigation is to make clear the pollution situation of benzene series and chlorinated hydrocarbons in the field, and through the analysis of the pollution field, and according to the different physical properties and requirements of the field, establish the electrical model of the potential of pollution Measurement criteria to accurately delineate the depth of soil and groundwater pollution and the spatial distribution of the contaminated area to provide reliable information for later construction.
Scope of Investigation and Evaluation
The scope of the survey and assessment is shown in the Figure 1-2 (before removal) and the blue frame of Figure 1-3 (after removal).

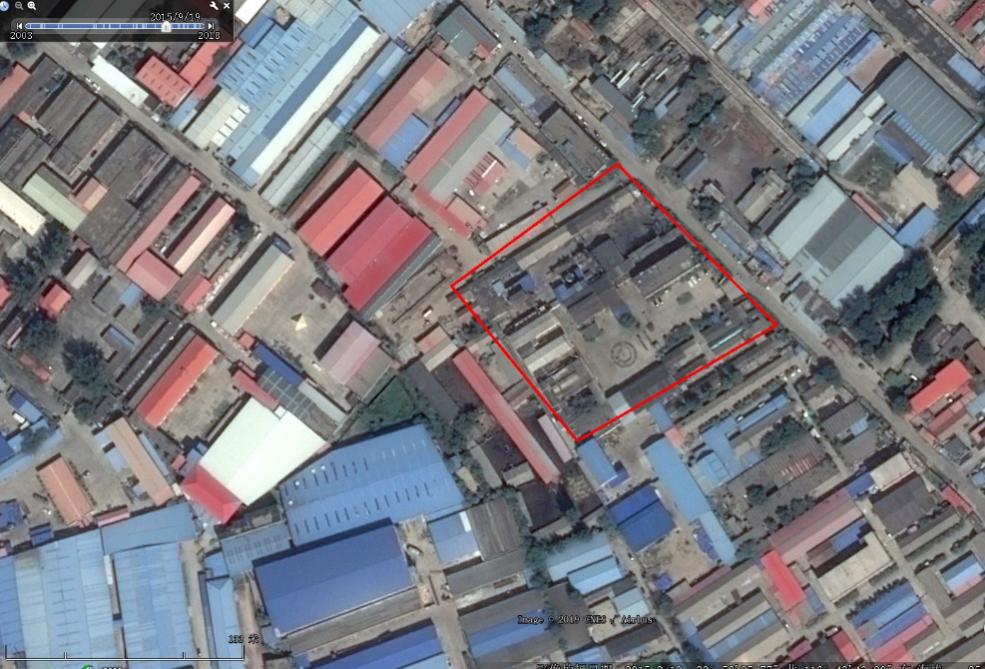
The location of the test plant scope is Nxx°xx′x″~Sxx°xx′x,Exxx°xx′x″~Wxxx°xx′x″. The east-west span is about 130m, the north-south span is about 120m, and the entire survey area is about 15000m2.
Topography and landform
The geographical coordinates of the region are Nxx°xx '~xx°xx', Exx°xx '~xxx°xx', 36.5km from east to west, 48km from north to south, the whole area is 907km2.
The whole region is flat and slightly undulating, and the landform can be divided into river terraces, floodplains, dune landform and artificial landform. In the north of the territory area, the ground elevation is more than 20m, the terrain is more complex, and presenting a gentle slope terraced landform characteristics; In the east, the terrain is high near the river and low at the far riverbed. In the west and south, it is high in the east and low in the west or high in the southwest and low in the northeast. There are slopes and dunes in the north; there are saline-alkaline areas in the south. The plot of the survey area is flat. The main river courses are mostly northwest and southeast.
Geology
The underground bedrock in the XXX area has high stability, poorly developed fracture gaps, and simple geological structures. The whole area is part of the XXX Plain, and the terrain slopes from northwest to southeast. The average altitude of the whole area is 20m, and the slope is 0.3% ~ 0.6%.
The groundwater storage conditions in XXX District are good, and the groundwater level is restricted by regional geological and hydro-geological conditions.
1. The water level generally begins to decline slowly at the beginning of the year and rises slightly in the middle of March;
2. The water level drops rapidly in April and May and the lowest water level value appears in May and June;
3. The water level rises and the highest water level value appears from July to September and slow decline after October.
The underground water below 100m maintains natural dynamic characteristics and above 100m is seriously over-exploited. The water level decreases year by year. The groundwater in the survey area is abundant and the buried depth is small.
According to the background data and existing survey data, it is estimated that the main contaminated area may be the production area and several known soil blocks, and the wastewater of the plant area may cause soil and groundwater pollution.
At the same time, due to the complexity of the work area, the unknown depth of the pollution range, and the different pollution levels, in order to maximize the effectiveness of the survey operation, the high-density resistivity method was used for this environmental geophysical detection method.
The detection depth of this survey is within 30 meters (at present, it has been detected that there is pollution in the range of 20 meters), which aims to find out the range, depth, hydro-geological distribution and abnormal signal area of the polluted plume. The main detection technical parameters of the method are shown in Table 3- 1.
Table 3-1 Basic technical parameters of Survey
Method | Depth | Array | Spacing of test points | Remarks |
ERT | Within 30M | Resistivity profiling | 1-3M | Detect the depth and scope of soil pollution |
Background value measurement in survey area by field electrical method
In order to fully understand the diffusion range of pollutants in the site of the survey area, it is necessary to adopt the background value of electrical method for the area around the site of the survey area, so as to obtain the difference of electrical characteristics of the contaminated underground water and soil.

FIG 3-1 Schematic diagram for obtaining background values (blue measurement line)
The location of background value collection must be selected as far as possible to be less affected by the target survey area, and the geological conditions need to be close to the site of the target survey area. As shown in FIG 3-1, the electrode spacing is 2 meters, the length of the measuring line is 200 meters, and the depth is expected to be 30 meters. The wenner-schlumberger array is used to find out the geological characteristics and aquifer conditions within 30 meters underground of the site as the background value of the target site.
According to the drilling results provided by party A, the strata in this survey area have obvious characteristics of horizontal stratification and deposition, so it is not necessary to add horizontal stratification testing line.
High-density resistivity survey
For accurate marking out the soil and groundwater pollution depth and the spatial distribution of pollution area, we plan to use ERT method to detect in the main pollution potential district, preliminary planning 15 ERT lines (FIG 3-2 blue lines), the east-west direction are 7 lines, north-south are 8 lines, the total length of all ERT lines are about 3000 meters and will be adjusted accordingly on the site.
In this method, the minimum interval coefficient is 1, the electrode spacing is 1-2 meters, the total number of electrodes will be determined accordingly on the site, the target detection depth is within 30 meters, and the estimated average pollution depth is 0 ~ 30 meters. When the measuring line is long, Roll-along survey will be adopted for forward measurement. Before the measurement, the ground resistance shall be tested first. After the ground resistance is normal, the data collection and measurement shall be started.

FIG 3-2 Schematic diagram of the preliminary planning of ERT line
The process of ERT operation is as follows:

(1)Arrange the appropriate testing line according to the purpose of the measurement; Determine the electrode spacing, array and distance between the switch relay.
(2)Record working date, weather, etc and record the terrain and features near the survey line.
(3)When the measuring line is not long, use a tape to control the distance between measuring points; When the measuring line is long, use GPS instruments to determine the position of the measuring point
(4) Use a percussion drill to break the road surface and insert the electrode into the soil at least 20cm below the road surface to ensure a good grounding connection.
(5)After connecting the survey line, measure the electrode ground resistance to ensure that the current flows into the ground. If necessary, inject salt water around the electrode junction or replace the original electrode with several electrodes in parallel.
(6)Connect the power supply to the resistivity device to start the data measurement.
(7)During the measurement, the operator must pay attention to the reaction between the electrodes on the mainframe and adjust the measurement parameters or re-measure if necessary
Geophysical methods are based on natural or artificially established geophysical fields to observe the physical properties of underground or invisible materials, and to infer physical properties of underground media based on abnormal changes.
For groundwater, the polluted underground water will change its electrical characteristics due to the intervention of pollutants, and the geophysical detection of groundwater pollution is exactly based on this change, and various geophysical methods are used to distinguish the polluted area from the unpolluted area. This change is reflected in geophysics as the local variation of geophysical field. Therefore, a mathematical model of the relationship between groundwater pollution and local variation of geophysical field can be established to realize detection.
Moreover, in the actual investigation and application, the pollutants are not single, so in the groundwater investigation, due to the presence of various conductive ions, the groundwater pollution will reflect the characteristics of relatively low resistivity.
The principle introduction of High density resistivity method
The geophysical survey in the work area is mainly based on the characteristics of the geological stratum structure and the change of geophysical properties in the survey area, and uses different detection methods to investigate. High-density resistivity can be applied to various pollution investigations, and it can also obtain very rich results.
This geophysical survey is to detect the distribution of soil pollution, ERT method has been adopted in the field work which can achieve a higher density in the horizontal and vertical directions and obtain the parameters of the resistivity of the rock and soil layer in a certain depth range, so as to detect the spatial distribution of each geotechnical layer and meet the purpose requirements.
Electric Resistivity Method or Direct Current Resistivity Method or Geoelectric Resistivity Method, is based on the difference in dielectric resistivity, observing the power supply current intensity and measuring the potential difference between the electrodes, and then calculating and studying the apparent resistivity to infer the distribution of underground buried waste or potentially contaminated soil. The measured result is the ground resistivity profile. The factors that affect the resistivity of the stratum include the constituent minerals, particle size, configuration, and the water content of the stratum and the substances contained in the water. It is suitable for the DC resistance method when the stratum has obvious resistivity contrast.

FIG 4-2 Schematic diagram of high density resistivity method
Compared with the conventional electrical method, the high-density electrical method has the following advantages:
1) The electrode layout is completed in one time, reducing the interference caused by the electrode setting and the measurement error;
2) Can effectively carry out a variety of array, so you can get rich geological information about the structure characteristics of the geoelectric cross section;
3) Field data collection is automated or semi-automated, which not only collects quickly, but also avoids errors due to manual operations;
4) The data can be real-time on-site and offline processing, greatly improve the intelligence of the electrical method;
5) Multi-parameter measurement can be realized, and resistivity, polarizability and natural potential can be observed at the same time, to obtain a wealth of underground geo-electric parameters, from different point of view to describe the underground structure.
Therefore, the high-density resistivity method is a detection method with low cost, high efficiency, abundant information, conveniently interpretation and significantly improved the investigation capability.

Industry-leading geophysical equipments and service provider supplier