

A certain chemical plant started to produce sodium dichromate in the 1980s, and its production process will produce solid waste chromium slag. According to the basic product, about 3 tons of chromium slag will be discharged per ton of sodium dichromate. In 2007, the chemical plant was shut down.
Entrusted, our company conducts an environmental geophysical investigation on the soil pollution of the chemical plant. This work combines the induction electromagnetic method (EM) and the high-density resistivity method (ERT). On the one hand, it conducts geophysical detection on a large area suspected of heavy metal soil pollution distribution to understands the distribution range and depth of the pollution; on the other hand, the off-site In the downstream area, through investigation, we can find out whether the pollution in the factory area has a tendency to spread, and provide reliable information for later restoration.
The induction electromagnetic method is suitable for large-scale waste burial locations and local investigation and evaluation of heavy metal-contaminated soils, and is suitable for rapid and comprehensive surveys, with the advantages of rapid investigation and high accuracy. After determining the abnormal distribution position in the survey area through the results of the induction electromagnetic method, combined with the high-density resistivity method, the actual depth in the vertical direction and the characteristics of the buried objects are ascertained. EM detection is carried out throughout the factory area, and a total of 13 ERT measurement lines (shown by the red solid line) are laid out.

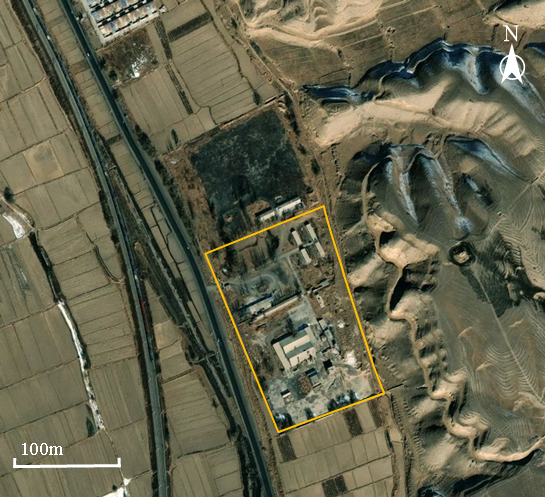
Figure 4 Layout of ERT survey lines in the survey area
In order to understand the resistivity distribution of unpolluted plots in this area, an area was selected in the upstream area outside the plant area for background value measurement.
It can be seen that the resistivity distribution of the background area is within the normal range, and there is no abnormal high or low resistivity. When the soil is polluted by heavy metals, the resistivity tends to be low and the conductivity is high, which is different from the surrounding rock. Therefore, the background value can be used as a basis. If there is an extremely low resistance phenomenon in the factory area, Most likely caused by heavy metal pollution.

Figure 5 ERT results of the background area
Achievements of Induction Electromagnetic Method
When the soil is polluted by heavy metals, the resistivity tends to be low and the conductivity is high, which is different from the surrounding rock. Therefore, the high conductivity in the EM results and the low resistivity in the ERT results, may be its potential area.

Figure 6 EM results in the factory area
Combining the EM results and the factory area data, the areas ①, ③ and areas ② above the high conductors are housing and buildings, and the areas ②, ④, ⑤ are the main pollution potential areas. According to the results, three pollution potential areas of low, medium and high are divided, of which the northern part of the plant area is a low pollution potential area; area ② is located in the thenardite field, which is a medium pollution potential area; area ④ is a leaching tank, which is a heavy pollution potential area. Potential area; area ⑤ is the chromium slag field, which is the potential area of heavy pollution.
Achievements of High Density Resistivity Method
The results of ERT survey lines located in different pollution potential areas are as follows:

Fig. 7 ERT1 measuring line located in the low pollution potential area
The results of the ERT1 survey line indicate that there is no abnormal pollution in this area.

Figure 8 ERT4 measuring line located in the medium pollution potential area
An extremely low resistivity anomaly appeared in the first half of the ERT4 survey line, with a distribution range of about 0-36 m and a depth of about 6 m.

Figure 9 ERT8 survey line located in the high pollution potential area
The results of the survey line are in good agreement with the EM results, and the main heavy metal pollution potential is located in the middle and back of the ERT8 survey line.

Figure 10 ERT12 survey line across medium and heavy pollution potential area
The beginning of the ERT12 measurement line is located in the middle pollution potential area in the middle of the plant, passing through the mill, underground storage tank, production workshop and open space of the chromium slag yard, and the end is located at the fence at the southern end of the plant. There is heavy metal pollution in the measuring line of about 66-84m and the depth of about 8-18m, and there is serious heavy metal pollution in the measuring line of 112-168m and the depth of about 8m.
At the same time, the measuring lines laid out outside the factory show that the pollution inside the factory has no tendency to spread to the downstream outside the factory.
In this survey, the induction electromagnetic method was used to quickly determine the main distribution of pollution in the factory area, and the polluted areas were divided into three pollution potential areas: low, medium and high. The results of the induction electromagnetic method are supported by the high-density resistivity method, and the depth of the pollution distribution is explored. The results of the two are highly consistent. The pollution in the factory area gradually increases from north to south, and the pollution depth is mainly in the shallow layer, within about 10m. In addition, the pollution inside the factory did not migrate outside the factory area.

Figure 11 Pollution potential zoning map of the factory area
The induction electromagnetic method technology has the ability to quickly find out the distribution of the conductivity of the formation. The actual location and range of the general pollutants are often due to changes in time or the surface environment, which cannot be judged from the on-site survey. The time and cost of investigation will be greatly increased, and the use of induction electromagnetic method can well find out the distribution of strata, evaluate the distribution of pollution, and provide reference information for subsequent soil restoration.
Industry-leading geophysical equipment and service provider supplier