
Project background
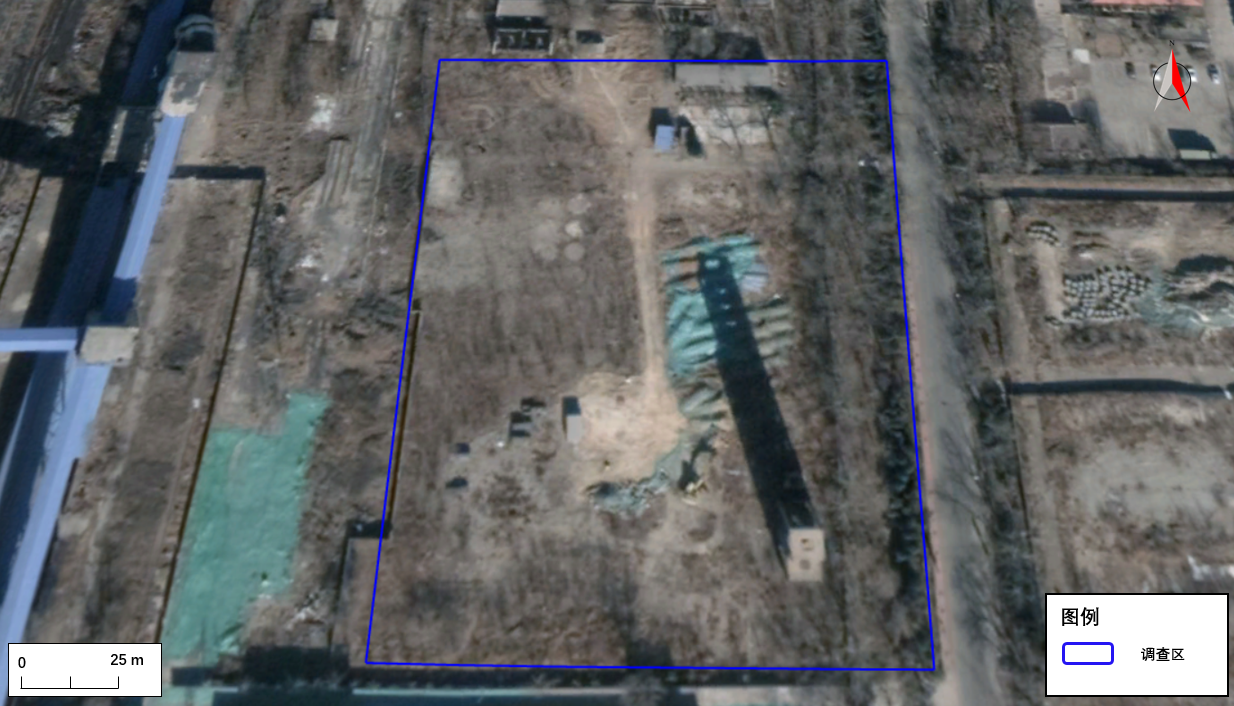
For the area of refined benzene block (hereinafter referred to as "investigation area") located in the original plant area of Shougang Co., Ltd. in Shijingshan, Beijing, the high-density electrical method of geophysical exploration is used to detect the distribution range and depth of organic pollutants in the area. The survey area is about 15500 square meters, as shown in the blue area in Figure 1-1.
At present, for the investigation of the distribution scope of DNAPL pollution such as underground organic matter, the traditional way of investigation is to speculate the possible distribution through limited borehole sampling or MIP, and to estimate the range and depth of pollution distribution through the correlation between the results of points; however, the traditional investigation often has the situation of complex site landfill and insufficient information of point sampling. Geophysical exploration is a non-destructive way to measure the underground landfill and stratum structure. In addition to the characteristics of no drilling, it can also obtain continuous profile data through a wide range of measurements. Therefore, it is suggested to use the electrical resistivity tomography(ERT) method in geophysical survey to survey the area. Through the survey of the resistivity distribution of underground materials, we can understand the scope and depth of the distribution of organic pollution, and make up for the shortcomings of traditional survey, so as to complement each other.
Purpose of the survey
The distribution range and depth of organic pollution in the detection field.
The site is detected by Wenner Schlumberger array, which combines the detection characteristics of two different permutations. The combination of Wenner's arrangement method and Schlumberger's arrangement method is more sensitive to the detection of horizontal and vertical structures. It is especially suitable for the unknown underground or complex sites. Therefore, it has a good analytical ability for this area. In this survey, considering that the abnormal depth in the survey area may be shallow, and more accurate estimation is needed, the electrode probe spacing of this survey is 2m, and the corresponding detection resolution is about 1m. A total of 10 ERT lines are arranged in the survey area, as shown in Figure 2-3 and 1 background line. The vertical distance between the background line and the survey area is about 100m.

Figure 2-3 layout of ERT survey line in survey area


Photos of some on-site work survey
Before the electrical resistivity tomography(ERT) test in the survey area, first select the area near the survey area to carry out ERT background measurement, to evaluate the normal resistivity of the unpolluted soil in the survey area, and use the measurement value in the background area to judge and compare the subsequent ERT measurement results.
ERT background line (Figure 3-1) is distributed from west to East. The distance between poles is 2 meters and the length of measuring line is 118 meters. The method of Wenner Schlumberger arrangement is used to measure. There are interferences such as roads and launch towers in the survey line accessories, so the data quality is good. The vertical distance between the background survey line and the survey area is about 100m.
It can be seen from the background ERT results that the resistivity of the whole background line is between 15-1750ohm-m, which is roughly stratified distribution. In the vertical direction, the resistivity should show the electrical distribution law of "low high low" change. A relatively high formation in the middle is speculated to be gravel layer.
Due to the fact that the conductivity of NAPLs is far less than that of water, compared with the low resistance background, the high resistance anomaly usually occurs. However, if the ruono site is abandoned for many years, benzene is a volatile and biodegradable pollutant, i.e. a compound that is easy to be weathered by the natural environment. The conductivity will obviously increase with the weathering degree and time, i.e. the low resistance sign may appear.
As there is gravel layer below the survey area, and no groundwater is found, if the organic matter exists in the gravel layer, it may be difficult to present relatively high resistance, so the pollution area can be inferred by judging the relatively abnormal morphological characteristics.
Therefore, according to the field data and resistivity medium characteristics, the cluster abnormal characteristics (resistivity higher than 400ohm-m) or relatively low resistance block (lower than 20ohm-m) are considered as abnormal blocks, and the pollution of ERT survey line in the survey area is evaluated.

Figure 3-1 results of ert1 high density resistivity method
As the investigation area is a plant with a long history and has a long history, it is inferred that the organic pollution in the investigation area may be weathered, so the ERT investigation results in this area focus on finding relatively low resistance.


Fig. 3-2 results of 3D grid of resistivity profile


Figure 3-3 2D resistivity profile results
It can be seen from the ert1 line in Figure 3-3 that the line is below 7 meters in depth, showing a very low value state, which is a typical low resistance shielding phenomenon. It is speculated that there may be interference such as metal pipes or cables under the line, resulting in the current can not be transmitted to the depth direction, resulting in a low resistance shielding site. Therefore, the data below 7 meters of the line are all false values, which can not be explained. At the same time, it presents three-dimensional in the later stage This line is not used in the grid diagram.
According to the two-dimensional section of high-density resistivity (Figure 3-3), the overall resistivity of the field can be roughly divided into two layers, and the vertical resistivity shows the electrical distribution law of "low-high" change, and the first layer is about 0-6m deep, the resistivity range is between 20-500ohm-m, so it is speculated that it is a backfill layer; the second layer is a relatively high resistivity layer below 6m deep, the resistivity is more than 400ohm-m, which is the layer Obviously, it is speculated to be gravel layer (with large particles) according to the site conditions. At the same time, combined with the background test results, the cluster abnormal features with relatively high resistance (resistivity higher than 400ohm-m) or relatively low resistance block (lower than 20ohm-m) in the survey area are regarded as abnormal blocks, and the pollution distribution of soil and groundwater in the survey area is evaluated.
Combined with the 3D grid map of electrical resistivity temography method (Figure 3-2), the resistivity of several survey lines in the survey area is less than 20 The relatively low resistance area of ohm-m and ert7 and ert9 have cluster relatively high resistance area (black dotted line area). It is speculated that it may be an abnormal area, which is easy to collect pollution, and the local resistivity value is less than 1 ohm-m. it is speculated that it may be a heavily polluted area. The abnormal average depth of pollution is 0-12 m, the shallowest pollution position is about 0 m, and the deepest pollution position is 20 m deeper than the survey line , which is not closed downward and has a downward expansion trend (see ert9 in Figure 3-2), and is located in the northwest corner of the investigation area.
On the whole, the characteristics of the abnormal area are mainly distributed in the front part of ert2 ~ ert4 and the back part of ert7-ert9, and the pollution is distributed in the front and back part of ert9, which is a seriously polluted area and other survey lines are locally distributed. And the anomaly mainly shows the characteristics of very low resistance (blue), which is speculated as the potential area of heavy pollution.
Finally, combined with ERT results, the main pollution potential area of the whole investigation area is estimated. The pollution area can be roughly divided into four parts, mainly distributed in the northeast and northwest angles of the investigation area, and there are also small shallow potential areas in the southeast corner, as shown in Figure 3-4, red dotted line area.

Fig. 3-4 distribution range of oil slick in investigation area
1. A total of 11 ERT lines have been tested, and th eoverall resistivity of the survey area can be roughly divided into two layers. The vertical resistivity shows the electrical distribution law of "low high" change. And the first layer is about 0-6m deep, and the resistivity range is 20-500ohm-m, so it is speculated that it is a backfill layer; the second layer is a relatively high resistivity layer below 6m deep, and the resistivity is greater than 400ohm-m, which is obvious. Combined with the site conditions, it is speculated that it is a gravel layer (with large particles).
2. The characteristics of the abnormal area are mainly distributed in the front part of ert2 ~ ert4 and the back part of ert7-ert9, and the pollution is distributed in the front and back part of ert9, which is a seriously polluted area and other survey lines. And the anomaly mainly shows the characteristics of very low resistance (blue), which is speculated as the potential area of heavy pollution. The average depth of pollution anomaly is 0-12m, the shallowest position is about 0m, and the deepest position is 20m deeper than the survey line, which is not closed down and has a downward expansion trend.
3. In the investigation of benzene and other organic pollutants, the abnormal characteristics of relatively high resistance are often found. However, as LNAPL is a volatile and biodegradable pollutant, with the increase of time, the conductivity of pollution will obviously increase (or the resistivity will decrease) with the weathering degree and time. Therefore, after decades of site, the abnormal characteristics of relatively high resistance are almost invisible, so Before the investigation, the basic situation of the site shall be fully understood.
4. The main purpose of environmental geophysics is to increase the field information from the original point to the surface and body, not to replace the traditional detection technology. More field information can verify the accuracy and timeliness of environmental geophysics methods, which is complementary to traditional drilling sampling.

Industry-leading geophysical equipment and service provider supplier