

The survey site was a decommissioned chemical plant in Nantong, Jiangsu Province, with a survey area of 120,000 square meters. Traditional drilling and sampling engineering has a large amount of work and a long cycle. Using high-density resistivity method and induction electromagnetic method, a wide range of surface measurements are carried out to determine the pollution level area and its depth range. Finally, combined with the results of the sampling analysis, the coverage of the entire underground space is detected, and the underground pollution and the current situation of the formation are described by the specific images of the geophysical results.
The focus of the work is to detect the distribution of soil and groundwater pollution in the survey area, and provide more objective decision-making basis for the remediation unit.
In order to find out the pollution distribution in the investigation area, a comprehensive induction electromagnetic survey is conducted for the site planning this time, and the conductivity distribution map within the site is drawn, and the high-density resistance method is applied to the high-conductivity block of the induction electromagnetic method. To assess the vertical depth of soil pollution, the survey completed the induction electromagnetic test area of about 120,000 square meters, high-density electrical method line 29 and background line, a total of 6430 meters.
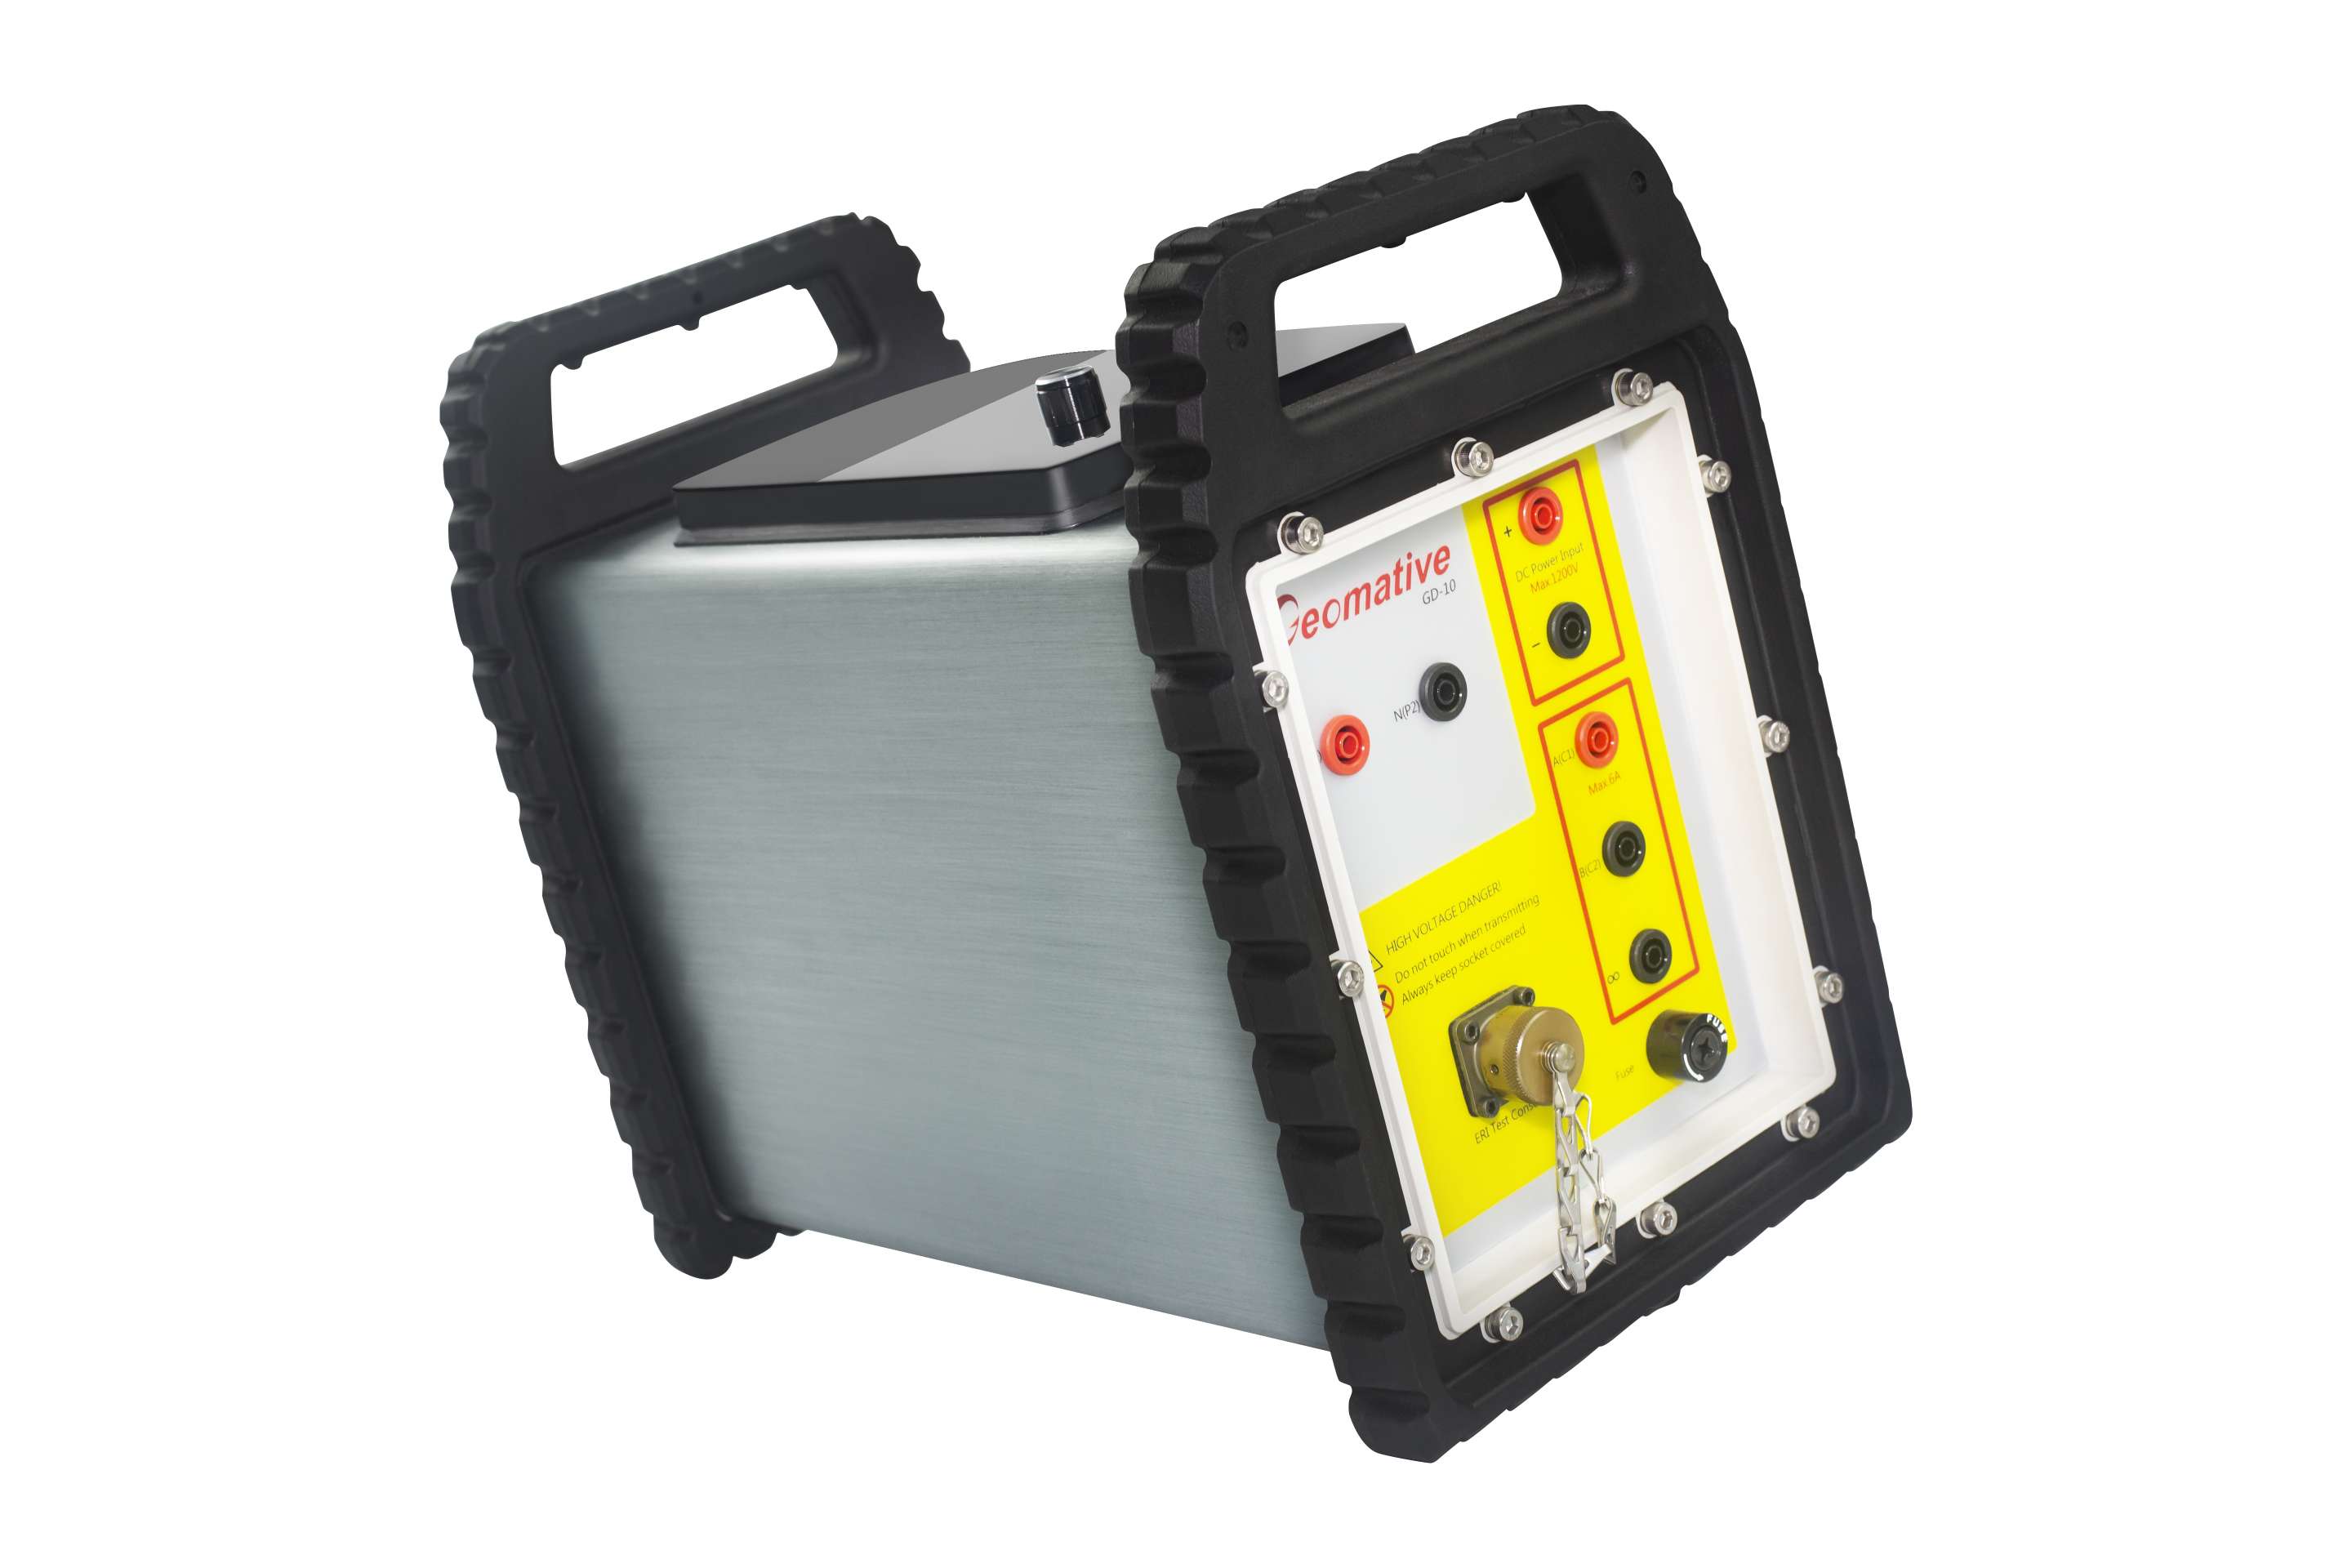
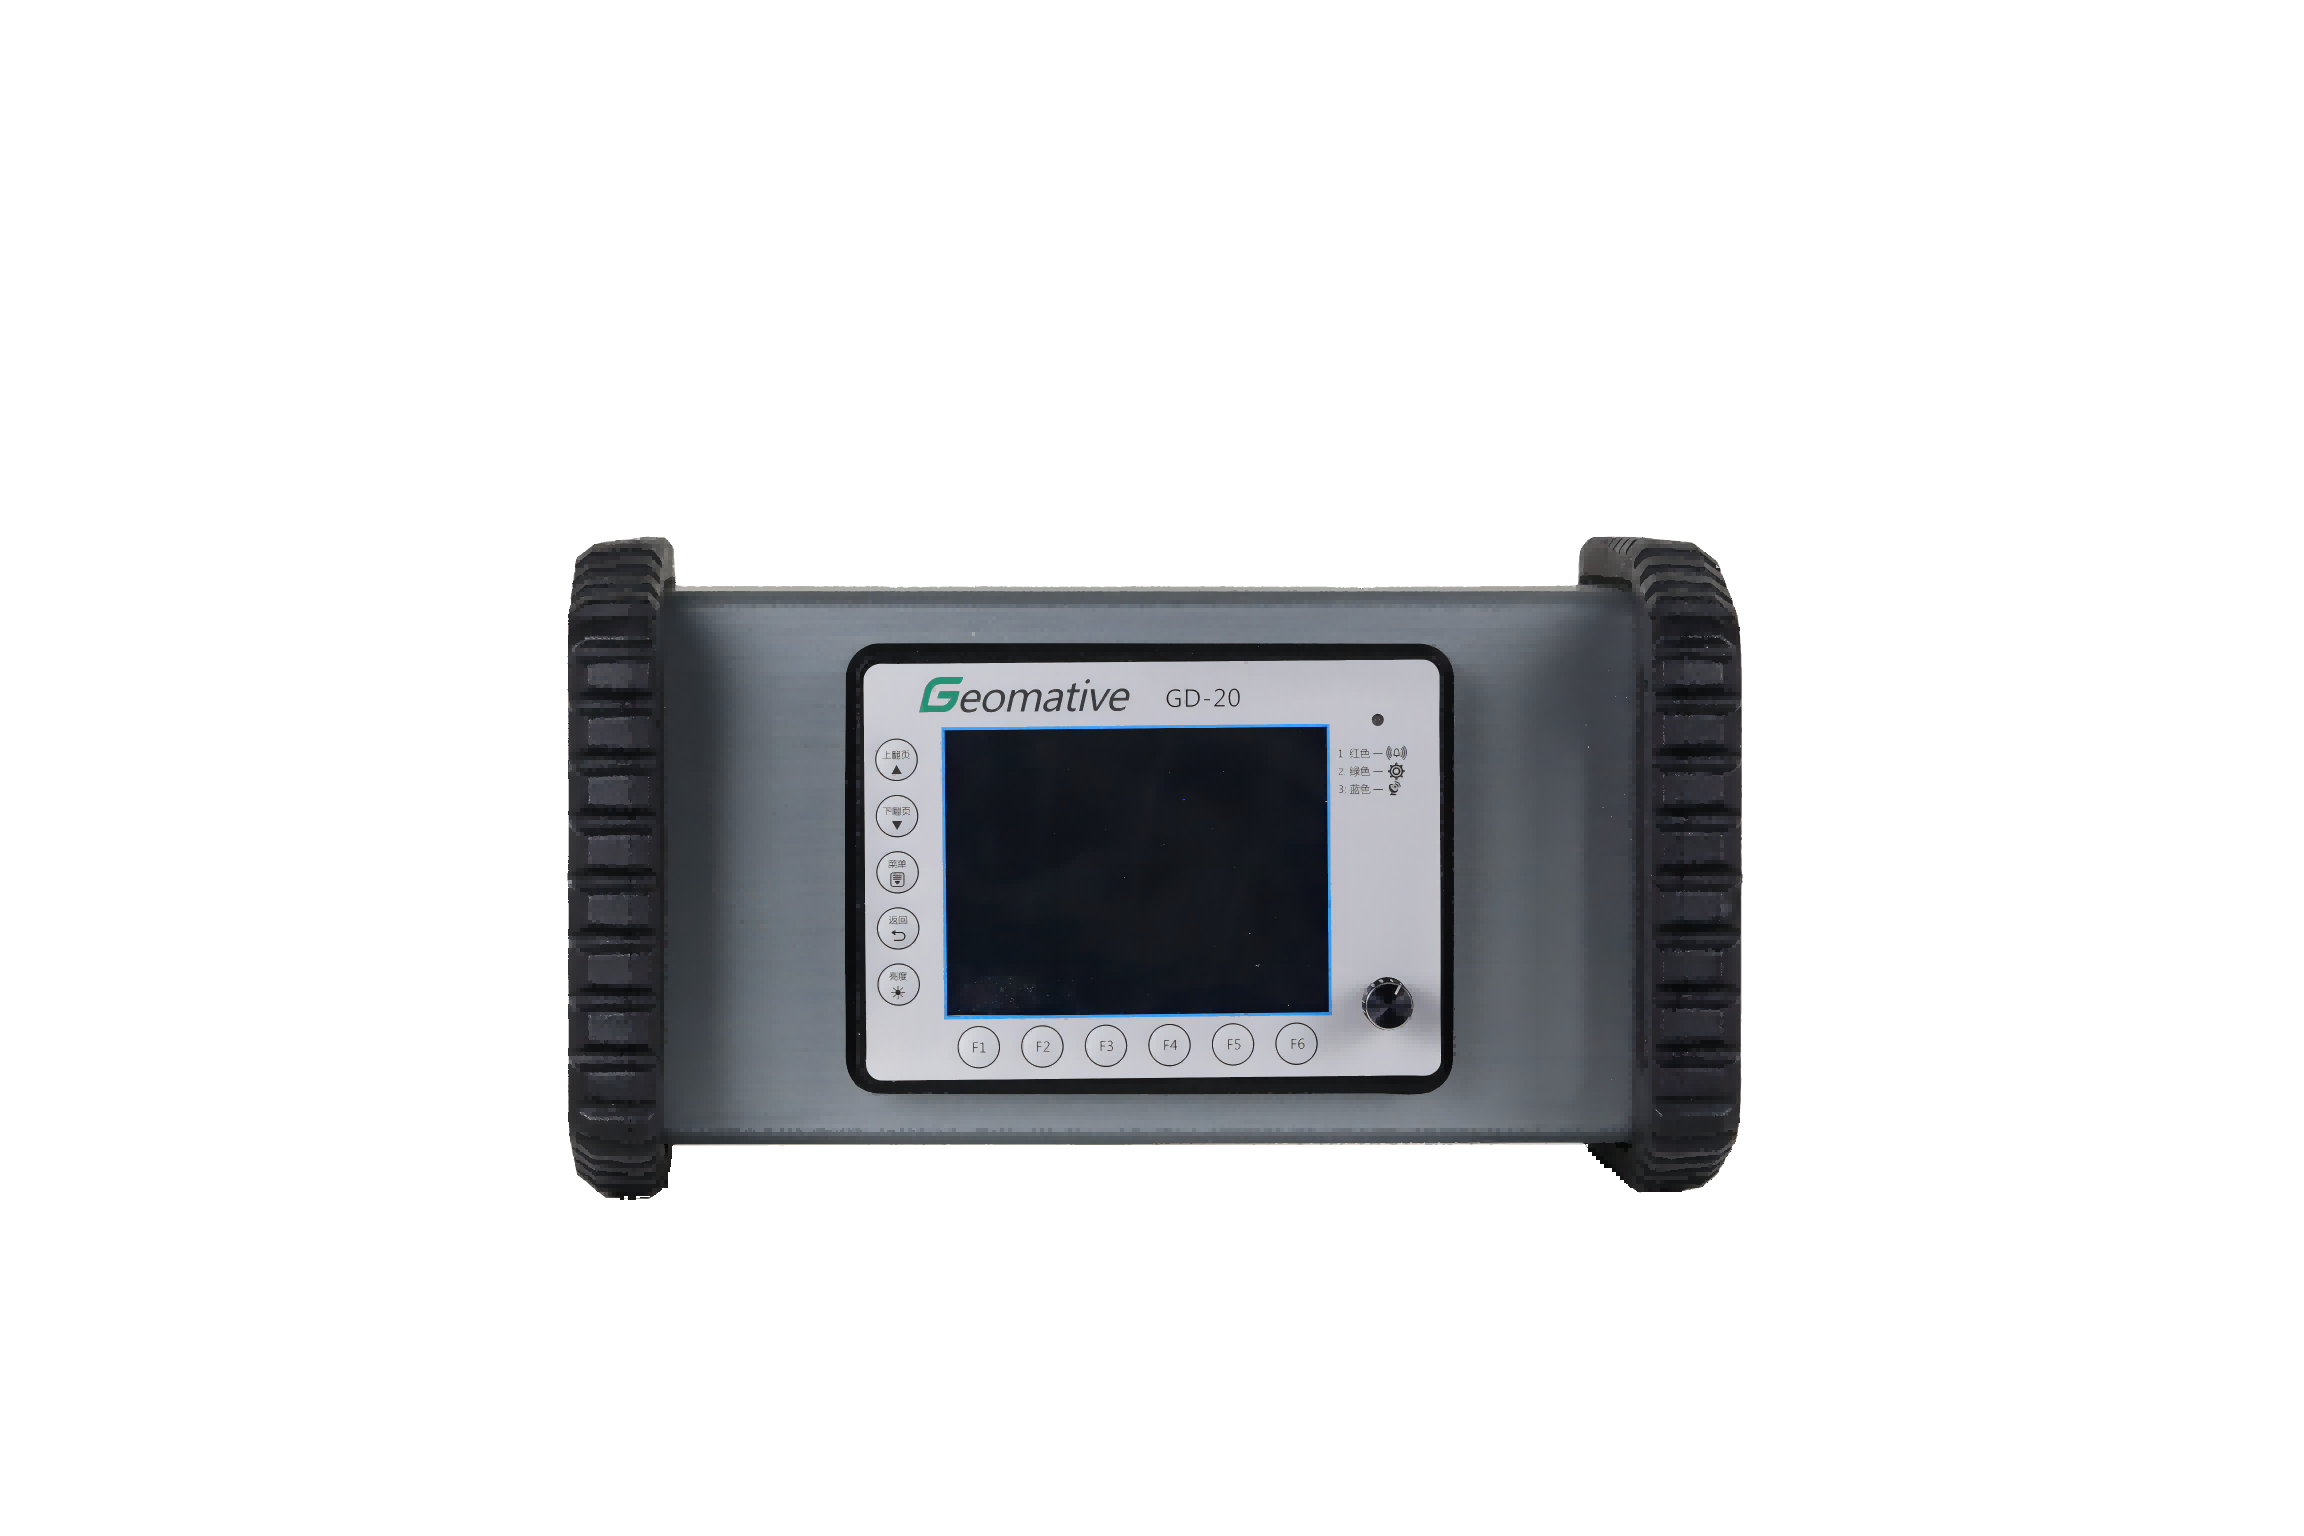
1 Equipment
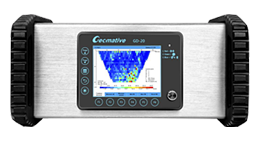
The GD-20 high-density DC electric system developed by Geomative and GEM-2 handheld broadband electromagnetic detector.
2 Principle method
Resistivity imaging: actively introduces DC current into the formation to measure the potential difference, and inverts the calculated material to depict the 2D or 3D structure of the formation with a resistivity distribution.
3 Technology
Inductive electromagnetic method with GPS positioning immediately when testing, sweeping the whole field.
High-density electrical method, the electrode device uses a four-stage device. The minimum spacing factor is 1, the electrode point is 2 meters, the detection target depth is within 20 meters, and the average pollution depth is estimated to be 0-20 meters.
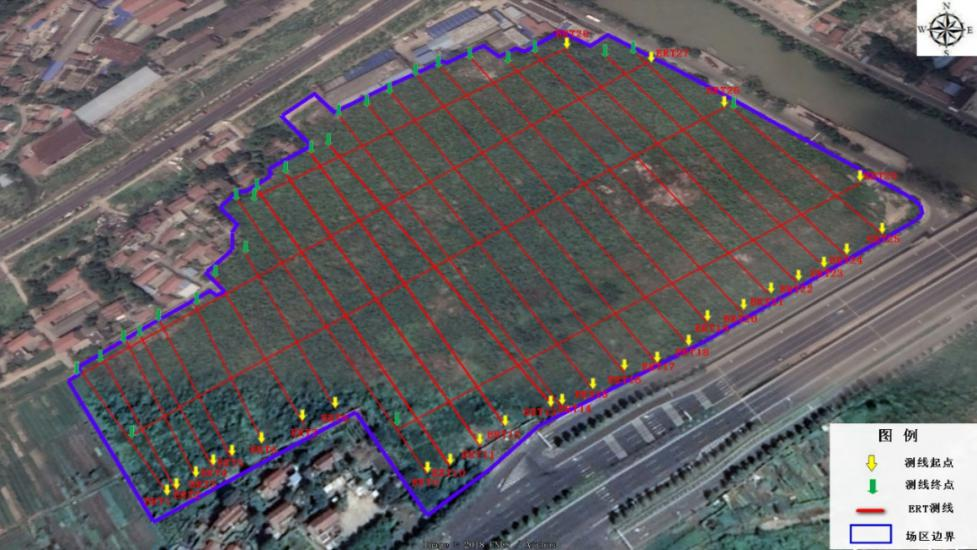
Figure : Blue is the boundary of the plant, the range of the induction electromagnetic method is scanned; the red line is the layout of the high-density cable.
Inductive electromagnetic method results
According to the EM detection results, the color gradation in the result graph represents high conductivity (low resistivity) in red, while the blue-violet color is in low conductivity range.
According to the on-site records, the blocks are (1), (2), (3), (4), (5), (6), which may be the main pollution potential areas, of which blocks (1), (2) ), (3), (5) are heavy pollution potential areas, and blocks (4) and (6) are relatively light pollution potential areas.

Figure 5-1 Results of the comprehensive conductivity of the survey area

Figure 5-2 Projection area comprehensive conductivity projection
High-density electrical method results
Line 14 shows that the overall groundwater level in the survey area is shallow and the average depth is about 1.6 meters. The overall anomalous results show a low-resistance distribution, which may lead to leakage of wastewater or acid in the production process or later, causing pollution of inorganic salts into groundwater, and moving along the deeper layers of the groundwater flow, resulting in NAPLS pollutants (if There are also leaks) that are highly concealed by highly conductive waste water and inorganic salt materials, thereby exhibiting low resistance characteristics.

Figure 5-3 ERT14 high-density inversion results
In order to more accurately observe the pollution distribution state of the measurement area, the resistivity results of the high-density resistivity method line 1 to line 29 are composed into a grid diagram to obtain a comprehensive high-density resistivity distribution result map of the field region.
Combined with the results of induction electromagnetic method, the abnormal region presented by ERT is basically consistent with the high-conductivity anomaly exhibited by induction electromagnetic method, and the measurement results are mutually verified.
At the same time, the pollution of the whole survey area can be roughly divided into three parts, as shown in Figure 5-4, which are located in the southwest corner of the field, the northeast direction of the field and the middle area of the field.

Figure 5-4 High-density resistivity method line 1~ line 29 grid diagram

Figure 5-5 Results of the most serious pollution collection area
Conclusion
1. Through this survey, delineate the scope of key pollution.
2. 0-2 meters on the surface, should be building backfill.
3.In the key pollution area, the abnormal pollution depth can reach 21.4 meters deep.
4. Local pollution with the migration of groundwater, the depth of pollution even reached 44 meters.

Industry-leading geophysical equipment and service provider supplier