

Purpose of the survey
Confirm the suspected or potential leakage area and the spatial distribution of pollutants.
Detect the distribution of formation hydrology.
Survey Method
The survey selected geophysical exploration of Electrical Resistivity Tomography for an area of approximately 90,000 square meters.
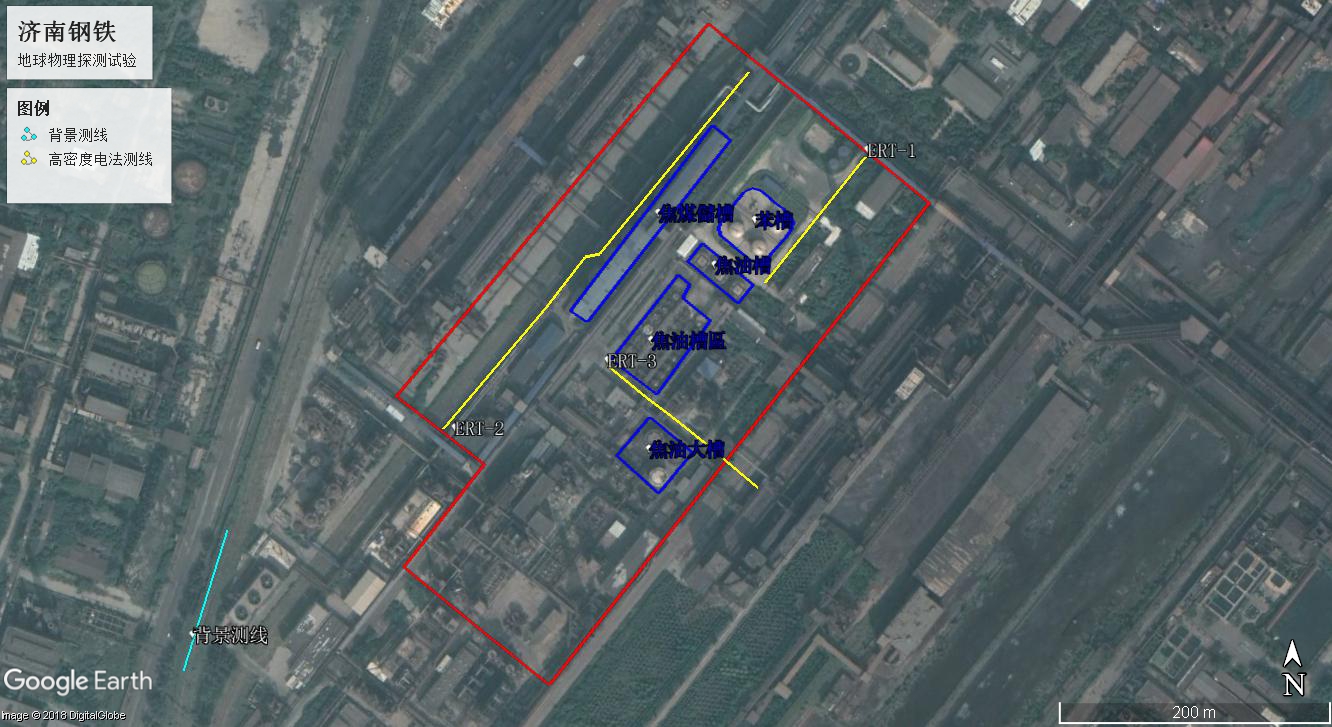
Reasonable layout of measuring lines is an important factor in obtaining high-quality data. This time, using high-density resistivity method, geophysical technology is used to detect large areas of suspected chemical pollution distribution and leakage. A total of 4 effective lengths of high-density electrical method are laid, one is background line and 3 are detection area lines(total 662m lines ). It is 90,000 square meters and can provide complete underground information for the owners according to the basic conditions such as the range, depth and abnormal signal area of the chemical pollution and leakage.
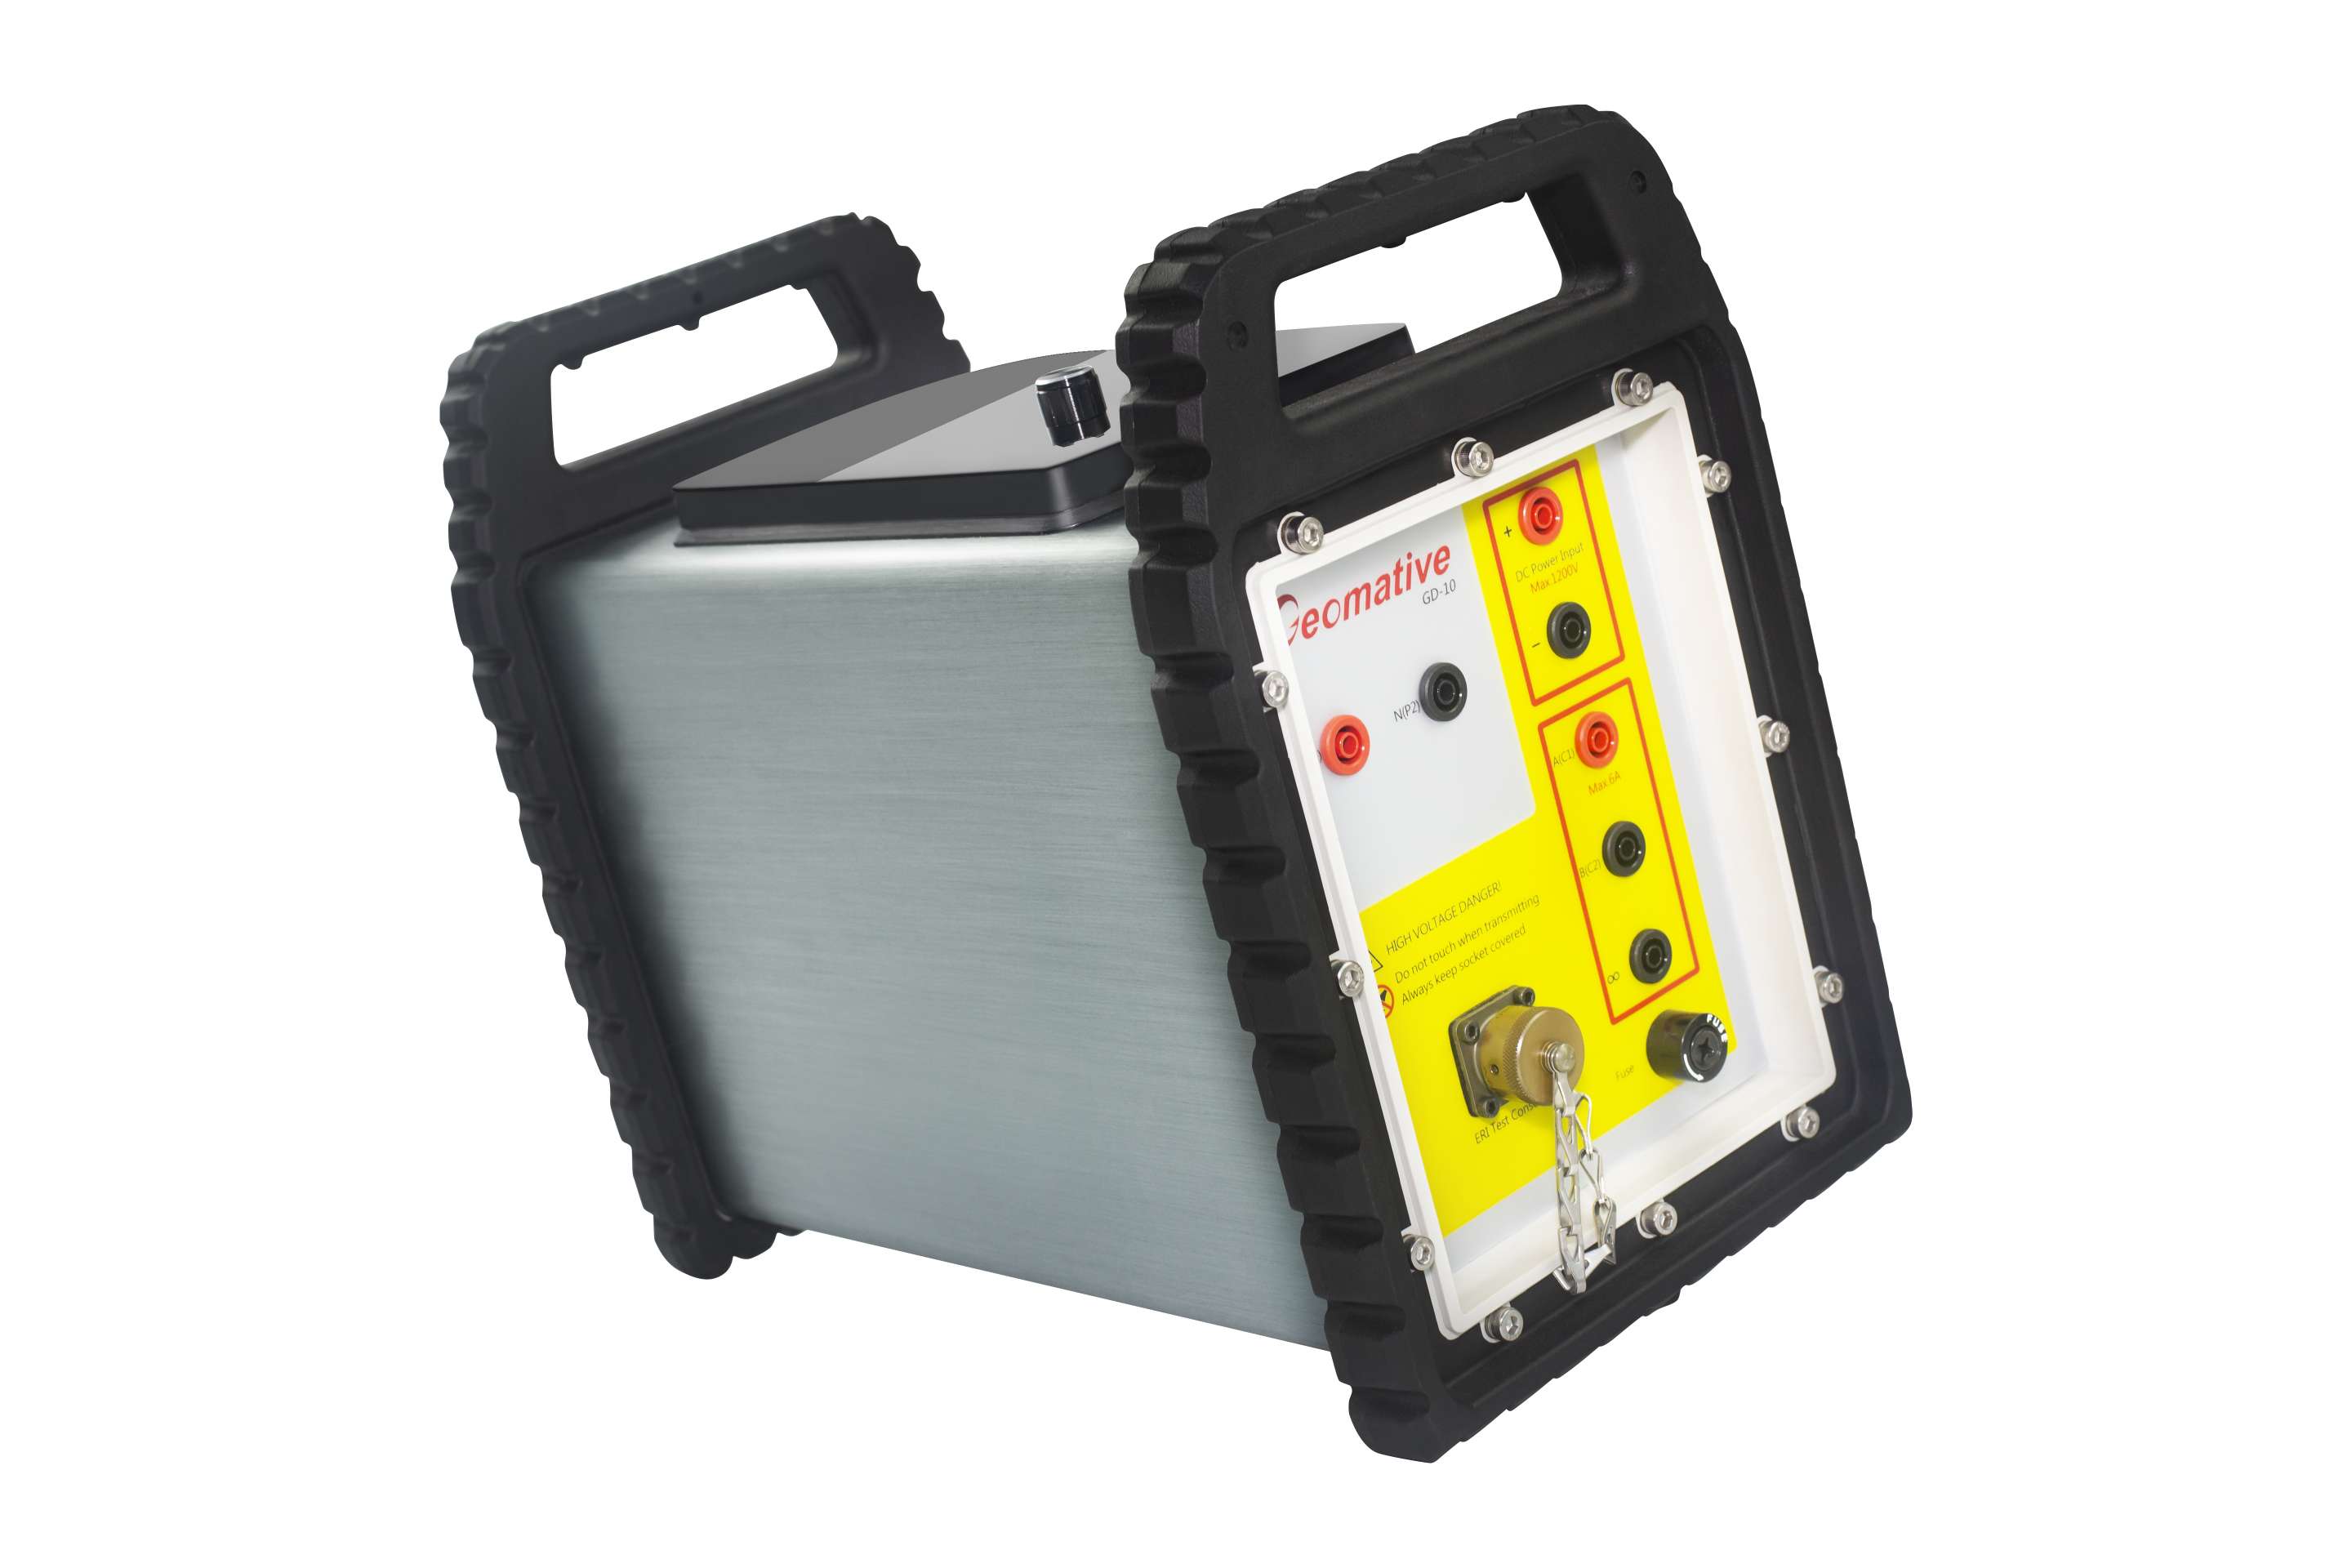
The resistivity method is a geophysical method based on the difference in dielectric resistivity. The detection principle of the DC resistance method is to establish an artificial electric field by using a direct current to pass a pair of current poles A and B into the ground. By the difference in conductivity between the interlayer media, another potential pair M, N can be used to measure the potential difference between the electric field between M and N, thereby obtaining the apparent resistivity of the formation and estimating the conductivity distribution of underground formation.
Advantage:
Deep depth, small terrain effect
Graphical representation of underground structures
Can be applied to well investigation
2D, 3D, 4D analysis
More specific quantitative indicators
Resistivity 20% or more difference with high resolution
Can be combined with other electrical surveys
Disadvantage
Have a certain in-line or lateral interference effect
If the background value is too similar to the target resistivity, the identification is difficult.

It is often presented as a cross-sectional equivalent image. Physical units often use resistivity(ohm-m) to represent different levels of color with different tones.

The total of 4 survey lines completed in this survey, total is 662 meters in length: background survey lines ERT-BG, ERT-01, ERT-02 and ERT-03. Through the resistivity distribution of the background survey line and stratum distribution , it is found that the background survey line resistivity is highly consistent with the stratum. Through the analysis of anomalous characteristics, the resistivity of the survey line ERT-01 and survey line ERT-02 in the superficial depth of 0 ~ 2.5 meters is more than 200Ω.m, it is presumed that the soil contains petroleum hydrocarbons, less than 5Ω.m scattered distribution, it is presumed that the soil contains coal cinder. There is a continuous horizontal layer distribution resistivity of less than 5Ω.m under 2.5 meters, presumed to be a contaminated soil block. The low-resistivity anomaly of the ERT-03 survey line profile at a horizontal position of 25 to 31 meters is caused by water gushing around the monitoring well A1S218; the high-resistivity anomaly at a horizontal position of 130 meters is caused by the backfilling of red bricks on roads. There are low reisistivity anomaly areas on the horizotal position of 4 to 36 meters, 40 to 54 meters, 66 to 84 meters, 94 to 98 meters and 100 to 126 meters are presumed to be contaminated soil block.
It can be speculated that the soil layer under the survey line contains coke breeze, which leads to the resistivity is mostly between 1 and 5Ω.m under 2.5m. The line ERT-02 has a surface resistivity more than 200Ω.m at a depth of 0 to 2.5 meters, which can be presumed to be non-conductive contaminants, such as petroleum hydrocarbon pollution. And the block with resistivity more than 200Ω.m has a downward extension trend, similar to the petroleum hydrocarbon pollution plume. It is easier to identify the pollution, and the concentration difference of the petroleum hydrocarbon pollution area can be judged to a certain extent.


Industry-leading geophysical equipment and service provider supplier