Geomative
  • Products
    • Resistivity and IP Tomography
    • Electromagnetic
    • Integrated Well Logging System
    • Airborne and Ground Magnetometers
    • Subsurface Environmental Monitoring System
    GD-12/22/32 1/6/12-Channel Resistivity IP Imaging System

    GD-12/22/32 1/6/12-Channel Resistivity IP Imaging System

    GD22 It integrates modules such as transmission, collection, control and power supply, and possesses capabilities of high-power transmission, high-precision signal collection, full waveform recording, IP induced polarization measurement, etc. Combined with professional acquisition APP and Geometa data platform, it is suitable for various scenarios of electrical exploration operations. It has a high protection level and strong environmental adaptability, and can meet the detection requirements in multiple fields such as geology, engineering and environment.

    GS-30 12-Channel Electric Receiving Station

    GS-30 12-Channel Electric Receiving Station

    GD-10 Electrical Resistivity & IP Imaging System

    GD-10 Electrical Resistivity & IP Imaging System

    The GD10 survey system adopts a modular and scalable hardware platform, enabling the collection of electrical survey data in various scenarios such as on the ground, in tunnels, and underwater. This system has brought a technological breakthrough to traditional engineering geophysical survey operations.

    GD-20 Multi-channel ERT/IP Imaging System

    GD-20 Multi-channel ERT/IP Imaging System

    The multi-channel collection method is more efficient and significantly reduces the construction cost.

    Laboratory Electrical Workstation

    Laboratory Electrical Workstation

    Multi-electrode resistivity imaging for versatile subsurface investigations.

    Learn more
  • DIGspace
    • DIGspace
    • Platform Fundamental Ability
    • Technical Methods
    • Applications
    • trial application & download
    DIGspace Platform

    DIGspace Platform

    Integrating geological, geophysical, and monitoring data into a unified subsurface cognition system. Deep analysis on desktop, collaboration on web.

    A 3D geospatial platform fusing multi-source survey data with surface spatial information — covering exploration analysis and long-term monitoring.

    Learn more
  • Solutions
    • Mineral Resource Exploration
    • Online Monitoring
    • Cross‑hole investigation
    • Hydrogeological Survey
    • Engineering Geology Investigation
    • Subsurface Environmental Monitoring
    Brazil Gold Ore Exploration Case

    Brazil Gold Ore Exploration Case

    Carry out geophysical exploration for sulfate zones with potential metal mineral resources in ESTADO DO PARÁ, Brazil, and locate metal ore deposits by electrical prospecting technology.

    Underground water and mineral exploration at Beishan Lead-Zinc Mine, Hechi, Guangxi

    Underground water and mineral exploration at Beishan Lead-Zinc Mine, Hechi, Guangxi

    Integrated geophysical solutions for mineral prospecting.

    Learn more
  • Support
  • About Us
中文Talk to an Expert
  • Products
  • DIGspace
  • Solutions
  • Support
  • About Us
Geomative

A provider of spatial intelligence technology and equipment, serving surveying, energy, transport and emergency response with fully self-developed hardware and software.

Products

  • Resistivity and IP Tomography
  • Electromagnetic
  • Integrated Well Logging System
  • Airborne and Ground Magnetometers
  • Subsurface Environmental Monitoring System

Industries

  • Mineral Resource Exploration
  • Online Monitoring
  • Cross‑hole investigation
  • Hydrogeological Survey
  • Engineering Geology Investigation
  • Subsurface Environmental Monitoring

Service & Support

  • Knowledge Base
  • FAQ
  • Document Downloads
  • Drivers & Software
  • Warranty Policy
  • Contact Support

copyright@2026 Geomative Co., Limited

Privacy PolicyTerms of UseSitemap
  1. Home
  2. Products
  3. Subsurface Environmental Monitoring System
  4. GEOMATIVE Real-Time Online Monitoring System

GEOMATIVE Real-Time Online Monitoring System

GEOMATIVE Real-Time Online Monitoring System
⚡ Resistivity Method · Microtremor · Multi-Source Sensor Integration

GEOMATIVE Real-Time Online Monitoring System

The system continuously acquires subsurface resistivity through high-density electrode arrays, and integrates multi-source sensors such as rain gauges, soil-moisture sensors, and tiltmeters. Data is transmitted over IoT to the cloud platform, where inversion, imaging, and alerting run automatically — delivering visual monitoring and early warning of subsurface hazards.

  • 7×24 Unattended
  • Minute-level Inversion Imaging
  • Multi-parameter Linked Alerting
  • Full-chain In-house Control
GEOMATIVE real-time online monitoring system

One System, a Clear View of the Underground

System Overview

Built on the direct-current (DC) electrical method, the system injects an electric field into the ground through an electrode array and measures the resistivity distribution, which is then inverted into results such as moisture content, phreatic line, and seepage channels — for continuous monitoring of evolving subsurface risks.

  1. Acquisition Layer
    High-density electrode arrays · Nodal seismographs · Multi-source sensors
    Array electrodes + nodal seismographs · piezo/optical rain gauges · soil moisture probes · tiltmeters
  2. Transmission Layer
    4G / IoT with integrated power
    Edge computing · remote commands · reliable data upload
  3. Platform Layer
    Cloud big data · Automated inversion
    Automated inversion · color-scale imaging · anomaly annotation
  4. Application Layer
    Alerts · Dashboards · Reports
    Tiered alerting · supervision dashboards · automatic weekly reports

📡Fully Automated, Unattended

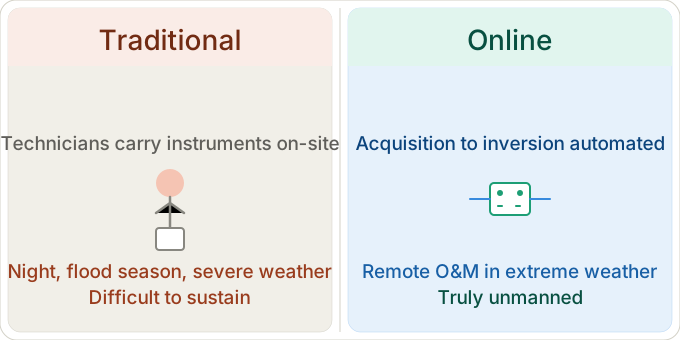
Acquisition, transmission, inversion, and result delivery run fully automatically, 24/7, with no on-site intervention — dramatically reducing O&M costs.

🧠 Online Real-Time Inversion

Resistivity, moisture, phreatic line, and permeability are jointly analyzed; 3D seepage-field and phreatic-line models are produced at minute-level speed, visualizing hazards in real time.

🔔Multi-Level Intelligent Alerting

Custom threshold calibration and tiered alerting, pushed precisely via SMS / WeChat / email / audible-visual channels — so hazards reach responders in time and disposition loops close.

Online Monitoring: Six Leaps Beyond Conventional Methods

Why Online Monitoring❓

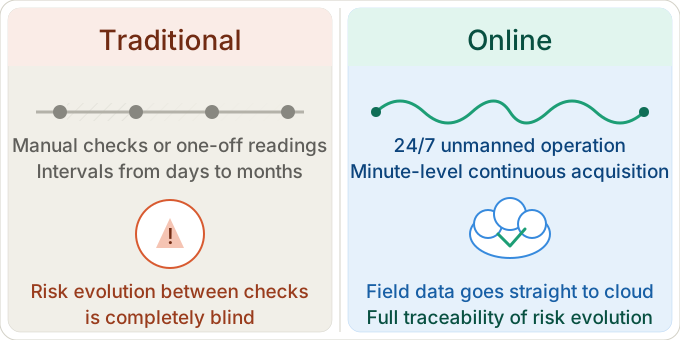
Conventional manual inspection is intermittent, limited in coverage, and slow to respond. Online monitoring delivers continuous acquisition, automatic transmission, and multi-parameter correlation — dramatically improving how efficiently subsurface hazards are sensed.

🔄From Periodic Spot Checks to Continuous, Real-Time Sensing

🔄From Periodic Spot Checks to Continuous, Real-Time Sensing

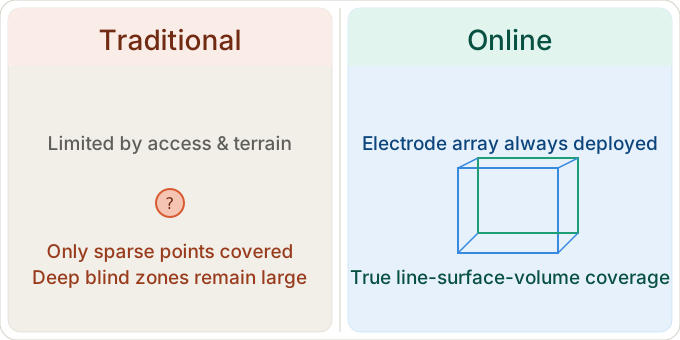
📐From Point Sampling to Full Cross-Sectional Coverage

📐From Point Sampling to Full Cross-Sectional Coverage

⚡From Post-Event Discovery to Proactive Early Warning

⚡From Post-Event Discovery to Proactive Early Warning

💰From Labor-Driven to Unattended Operation

💰From Labor-Driven to Unattended Operation

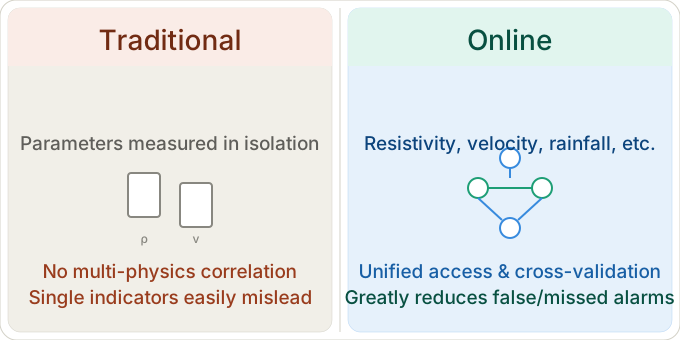
🧩From Siloed Single Parameters to Multi-Source Correlation

🧩From Siloed Single Parameters to Multi-Source Correlation

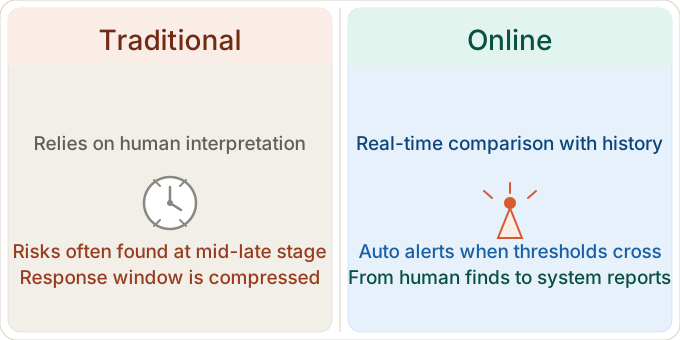
📈From Judgment by Experience to Data-Driven Decisions

📈From Judgment by Experience to Data-Driven Decisions

Geophysical Exploration + Sensor Fusion Monitoring: Three Upgrades Compared with Single Sensors

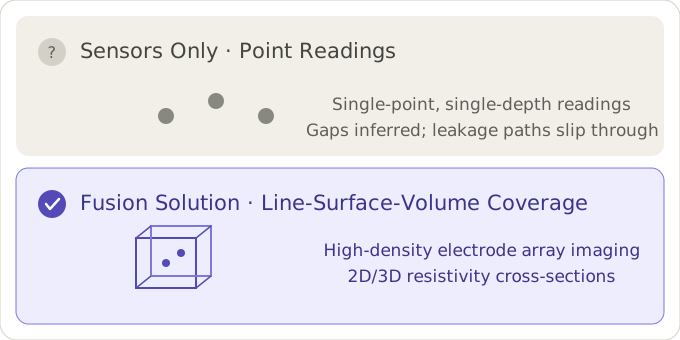
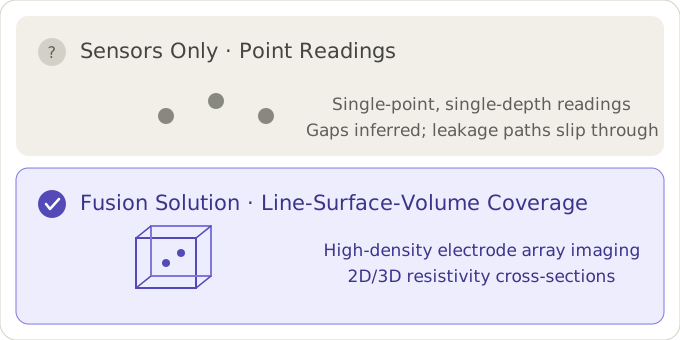
Conventional sensors — piezometers, moisture probes, tiltmeters, displacement and rain gauges — are the precise "anchor points" of any monitoring system, yet they only sense at their installed positions. Geophysics adds the spatial dimension: point and area combined, cross-validated — subsurface hazards become visible more completely, earlier, and more accurately.

🗺️From "Point Readings" to "Point + Profile, Stereoscopic Coverage"

🗺️From "Point Readings" to "Point + Profile, Stereoscopic Coverage"

🎯From "Measure Only What You Predicted" to "Full-Domain Scans That Reveal the Unknown"

🎯From "Measure Only What You Predicted" to "Full-Domain Scans That Reveal the Unknown"

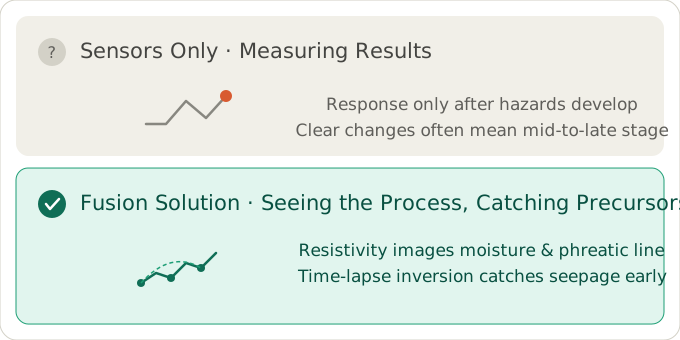
🌊From "Measuring Outcomes" to "Seeing the Process, Catching Precursors"

🌊From "Measuring Outcomes" to "Seeing the Process, Catching Precursors"

Geophysics and sensors are complements, not substitutes — sensors provide precise point values and trigger quantities (rainfall-driven acquisition densification, moisture-calibrated electrical interpretation), while geophysics provides spatial coverage and process imaging. Only their fusion forms a complete system for sensing subsurface risk.

DIGspace — From Offline Processing to a Closed Online Workflow

The platform uniformly connects geophysical methods — resistivity profile imaging, passive-source velocity tomography, current-field methods — along with multi-source sensors: rainfall, soil moisture, tilt, seepage pressure, and displacement. It closes the loop online across device management, acquisition, processing, analysis, visualization, alerting, and result delivery, and supports automated tasks, plugin-based extension, and integration with owners' systems.

Multi-Method Unified Access

Platform capabilities are fully decoupled from specific geophysical methods: one platform carries resistivity profile imaging, passive-source velocity tomography, current-field methods, and more, while uniformly connecting piezo/optical rain gauges, soil moisture probes, tiltmeters, piezometers, GNSS displacement stations, and other sensor networks. Devices, tasks, data, and results are managed within a single system — avoiding duplicate system construction across methods and monitoring means. • Geophysical methods: resistivity imaging, passive-source velocity tomography, current-field methods and more on one platform • Sensor networks: rainfall, moisture, tilt, seepage pressure, displacement, and other sources unified • Core value: one platform, multiple methods, no duplicate construction
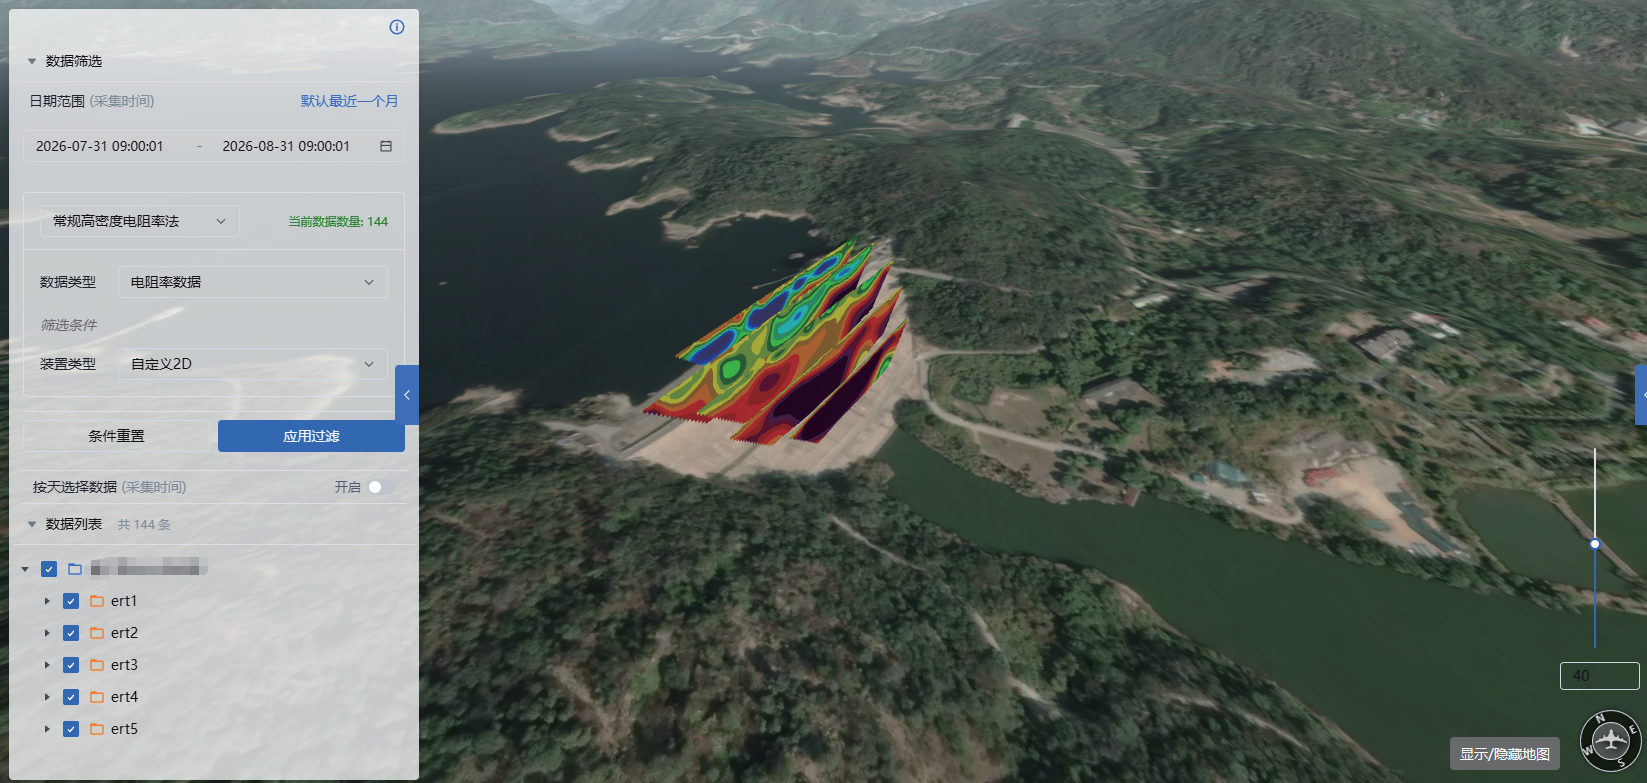
Multi-method unified access

Cloud Automated Processing & Computation

Once users configure tasks and processing strategies online, the platform executes them automatically, with compute resources provided elastically by the cloud. Each geophysical method is served by matching processing and computation capabilities; data ingestion triggers events automatically, the inversion → topographic masking → anomaly annotation chain flows hands-free, and missing parameters degrade gracefully. • ERT online processing: RMS filtering, valid-data screening, inversion, topographic masking, anomaly annotation • Current-field online processing: acquisition, management, and analysis within a unified task system • Automated tasks: configured online, run automatically, computed in the cloud

Cloud automated processing and computation

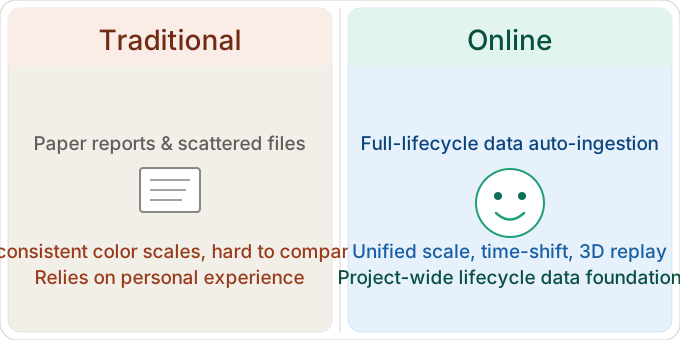
Professional Online Visualization

Professional online visualization built for geophysical interpreters — addressing the pain points of legacy software: hard-to-compare sections, inconsistent color scales, and tedious result production. Data moves from "viewable" to "clear, interpretable, and comparable." • Rendering optimization: smooth contours, densified color scale in key zones, topographic overlay • Globally unified color scale: sections across survey lines and periods compare directly • Automatic anomaly marking: custom thresholds, types, and styles for fast anomaly locating • 3D and time-series display: 3D layers and animated playback of subsurface change

Professional online visualization

Remote Online Device Control

A key capability that sets an online business platform apart from traditional offline professional software. Field geophysical devices and multi-source sensors are registered on one platform: parameters configured, tasks dispatched, and acquisition started or stopped remotely, with online status and progress monitored in real time — turning field devices from "manually operated instruments" into "online monitoring nodes managed by the platform." • Multi-device management: many instruments registered and remotely configured in one place • Real-time status: online state, acquisition progress, and sensor health at a glance • Scheduled/periodic acquisition: for long-term, continuous, unattended monitoring

Remote online device control

Online Anomaly Monitoring & Alerting

From "people looking for anomalies" to "the system finding them proactively." The platform links geophysical monitoring data, sensor time series, analysis rules, and alerting mechanisms; it continuously fetches the latest data on each task cycle, judges anomalies automatically, and pushes alerts through multiple channels — driving closed-loop operations. • Automated monitoring: periodic ingestion of geophysical and sensor data • Automated analysis: anomaly judgment against preset rules • Alert delivery: WeChat / SMS / email multi-channel reach • Closed loop: detection → confirmation → disposition

Online anomaly monitoring and alerting

Standardized Online Deliverables

The platform extends the business chain all the way to project delivery. Processed data, maps, anomaly records, and sensor time-series curves are organized automatically against preset templates into standardized project reports. The general platform can also be quickly tailored into industry-specific systems for reservoir dams, slopes, tailings ponds, and more. • Standardized report templates: data, maps, and anomaly records organized in one click • One-click report generation: shortening the last mile from data to report • Industry customization: water resources, geohazards, mining, urban geology, and more

Standardized online deliverables

Automated Task Engine

A built-in task-scheduling engine orchestrates "acquisition — processing — analysis — alerting — deliverables" into a configurable automated pipeline. Define task templates and trigger rules once, and the system executes them by cycle or by event without any manual intervention — the core foundation of long-term unattended online monitoring. • Cyclic scheduling: set acquisition and processing frequency by minute/hour/day, with adaptive strategies such as flood-season densification and dry-season reduction • Event triggers: data ingestion, rainfall threshold breaches, and device-online events automatically launch downstream tasks — no polling required • Task orchestration: inversion → topographic masking → gridding → anomaly annotation → alert judgment → report generation, chained end to end • Robust operation: task status fully visible, failures retried automatically, missing parameters degrade gracefully — a failed task never blocks the pipeline

Automated task engine

Plugin-Based Capability Extension

The platform kernel is fully decoupled from business capabilities: geophysical methods, device protocols, processing algorithms, alerting rules, and report templates are all loaded as plugins. Facing a new industry scenario requires no kernel changes and no system rebuild — simply develop and register the corresponding plugin to extend capability. • Method plugins: adding a new geophysical method (e.g., passive-source velocity tomography, electromagnetics) means plugging in its data model and processing chain • Device plugins: new instruments and sensors come on board quickly via protocol templates into unified device management • Algorithm plugins: inversion, filtering, and imaging algorithms can be swapped or stacked per project, including in-house algorithms • Business plugins: alerting rules, report templates, and visualization layers tailored per industry — one kernel, many scenarios

Plugin-based capability extension

Integrability · Embedded in Owners' Dashboards

Beyond standalone use, the platform is designed as a capability provider that integrates into owners' existing IT systems. Monitoring outputs flow into smart water-resources, smart mining, and emergency-command dashboards as data APIs, layer services, or embedded pages — avoiding new information silos. • Open data APIs: standard RESTful outputs of monitoring data, inversion results, anomalies, and alert records • Page-level embedding: inversion sections, 3D models, and time-series curves mount directly on owners' dashboards as embedded pages • Result map services: section maps, 3D fence diagrams, and unified-color deliverables pushed or fetched on demand • Alert integration: alert events stream in real time to owners' platforms and command systems, entering unified disposition workflows • Single sign-on: integrates with owners' unified identity systems — no second login for users

Integrability and dashboard embedding

Future-Proof Extensibility

A microservice, modular architecture reserves interfaces for next-generation geophysical methods and intelligent capabilities — protecting long-term investment, with no system rebuilds as business evolves. • Multi-method joint analysis: resistivity and passive-source velocity already invert jointly, with electromagnetics and more on the roadmap • Intelligent analysis: inversion acceleration, intelligent anomaly recognition, assisted interpretation • 3D geology / digital twin: monitoring data fused with engineering spatial models • Edge computing & cloud SaaS: compute on demand, elastic scaling

Future-proof extensibility

Monitoring Instruments

Monitoring Instruments

Resistivity imaging and multi-source sensors monitor in synergy. We provide complete ERT and microtremor (passive seismic) instrument sets, compatible with conventional rain gauge, soil moisture, and tilt sensors — supporting device access, data transmission, joint inversion, and multi-source integrated analysis with cross-validation, for long-term online safety monitoring of geological bodies.

Resistivity Profile Imaging

GD Series · Segmented-Concentrated High-Density Technology An industry-leading multi-function DC electrical instrument with proprietary segmented-concentrated cabling — combining the deployment efficiency of distributed wiring with the reliability of concentrated wiring. It supports 2D/3D rolling surveys and continuously acquires subsurface resistivity online. A high-density electrode array injects a steady current into the ground while measuring potential differences; apparent resistivity is computed for Wenner, Schlumberger, and other arrays, then inverted into a true subsurface resistivity section. Differences in moisture, density, composition, and structure all produce resistivity contrasts; periodic repeat measurement yields time-lapse comparisons that dynamically capture seepage, phreatic-line rise, contamination spread, and other subsurface processes. Method:Array electrodes · Wenner / Schlumberger Capability:2D/3D sections & rolling surveys Channels:60 per unit · multi-unit cascading Acquisition 24-bit ADC · ≥120 dB mains rejection Outputs:Resistivity / moisture / phreatic line Transmitter Max 7,200 W · 0–250 V constant current Mode:Scheduled / periodic auto acquisition · time-lapse comparison Strength:High interference immunity · excellent data quality 适用:Seepage channel locating、Phreatic-line monitoring、Contamination plume tracking、Time-lapse inversion、3D fence imaging

GD-series resistivity profile imaging instrument

Passive-Source Velocity Tomography

Nodal seismographs · single / three-component · 4G real-time transmission The platform supports nodal seismographs that acquire the weak ambient vibrations ever-present in the environment; dispersion-curve extraction and surface-wave tomography yield the stratum shear-wave velocity structure, which mutually constrains the resistivity result — invertible independently or jointly, resolving the uncertainty of a single electrical parameter when characterizing subsurface structure. Passive signals originate from ambient vibration — wind, flowing water, traffic — with no artificial source required. Array stations record passively over long durations; spatial autocorrelation (SPAC) / frequency-wavenumber (F-K) analysis extracts Rayleigh-wave dispersion curves, and tomographic inversion produces the 2D/3D distribution of shear-wave velocity (Vs) with depth — delineating weak interlayers, loose zones, bedrock surface, and voids. Channels:1 (single-component) / 3 (three-component) ADC / range 32-bit · 145–150 dB total dynamic range Sampling:0.25 ms – 20 ms selectable Geophone:2 / 5 / 10 Hz options · external deep-burial supported Timing:±1 µs – ±10 µs (GNSS disciplined) Power / protection Solar-powered continuous operation · IP68 Formats:SEG-D / SEG-2 / SEG-Y / SAC / miniSEED Outputs:Dispersion curves / Vs tomography sections / microseismic events Applications:Passive surface-wave survey、Velocity tomography、Microseismic monitoring、Structural health monitoring、Joint resistivity–velocity inversion

Nodal seismograph

Piezoelectric Rain Gauge

KH.YDS · maintenance-free · no moving parts A rainfall monitoring device developed for the hydrology and water-resources sectors; it measures rainfall via the piezoelectric principle and monitors continuously around the clock. The impact force of falling raindrops on the sensing surface measures drop size and computes rainfall; the domed cover sheds water entirely, staying maintenance-free in all weather conditions. Range:0 – ∞ Resolution:0.01 mm Sampling:1 Hz Power:DC 12 V Interface:MODBUS protocol Outputs:Cumulative rainfall / intensity / peak intensity

Piezoelectric rain gauge

Optical Rain Gauge

Infrared scattering · non-contact measurement Based on optical principles: rainfall is measured by detecting the scattering of light by raindrops, with infrared light as the measurement medium — high accuracy and fast response. When raindrops enter the detection zone, they alter the light-intensity distribution; scattering-type devices sense the intensity changes produced by refraction and reflection off the drops, from which rainfall is computed. Sensing diameter 6 cm Resolution:0.1 mm Accuracy:±5% Peak intensity 24 mm/min Power:DC 10–30 V Output:RS485

Optical rain gauge

Soil Moisture Sensor

Dielectric method · international standard By measuring the soil dielectric constant, it directly and stably reflects the true moisture content of all soil types, reported as volumetric water content. The dielectric method conforms to the current international standard for soil moisture measurement; corrosion-resistant purpose-built electrodes, sealed in flame-retardant black epoxy, IP68-rated — suitable for long-term burial. Range:0–100% Resolution:0.10% Accuracy:0–50%: ±2% / 50–100%: ±3% Power:DC 5–30 V Protection:IP68 Output:RS485 (Modbus)

Soil moisture sensor

Tiltmeter

MEMS gravity-based Based on the law of inertia, it measures tilt by detecting the change in the gravity component acting on the sensing axis. Widely used in bridge deformation monitoring, construction machinery leveling, and disaster early warning. The core is a gravity-type MEMS accelerometer that senses the gravity component on the sensitive axis at rest; the tilt angle is computed trigonometrically, with Kalman filtering suppressing vibration interference. Range:±30° / ±60° / ±90° Accuracy:0.1° / 0.2° / 0.3° Resolution:0.1° Power:DC 12–24 V Interface:RS485 Consumption <0.15 W

Tiltmeter field installation

Field-Proven Scenarios, Deliverable Results

The system is deployed across reservoir embankments, landfills, slopes, chemical parks, and rare-earth mines, serving enterprise clients with multi-parameter time-lapse results, 3D models, and section fence diagrams for subsurface hazard identification and early warning.

Case 1 · Reservoir Embankment · Seepage Monitoring

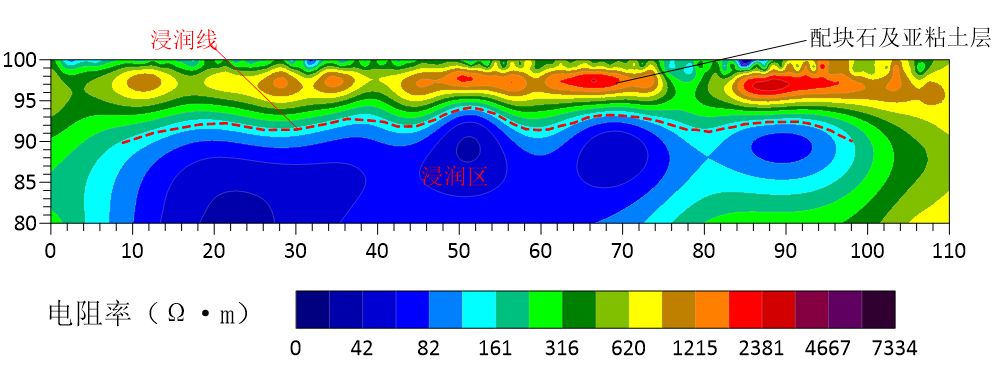
Dam seepage anomalies, hidden leakage paths, and phreatic-line rise are highly concealed and high-risk; conventional patrol inspection and single-point monitoring leave blind zones and lagging data. Built on the geoelectric field and automated inversion, the dam seepage monitoring system runs 7×24 fully automatically, adaptively adjusting acquisition frequency with reservoir level and weather, and cross-validating displacement and seepage-pressure data. It dynamically generates the 3D phreatic line, with tiered alerting, automatic reports, and dashboard integration. Successfully demonstrated on multiple medium-to-large reservoirs, it delivers multi-parameter time-lapse results, 3D models, and dam section fence diagrams that precisely characterize seepage evolution — safeguarding flood-season safety and smart O&M.

  • Dynamic 3D phreatic-line characterization

  • Multi-parameter time-lapse results

  • Flood-season adaptive densification

Gallery
3D topographic multi-section resistivity fence diagram from online dam monitoring
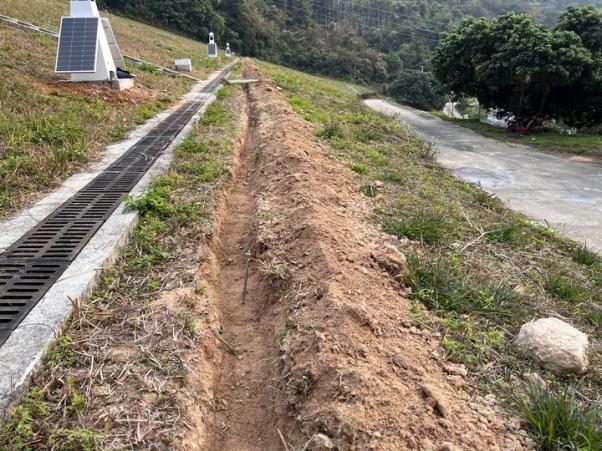
Cable trench and solar-powered monitoring nodes installed on a dam crest
Dam resistivity inversion section with phreatic line and saturated zone interpretation
3D topographic multi-section resistivity fence diagram from online dam monitoring
Cable trench and solar-powered monitoring nodes installed on a dam crest

Case 2 · Landfill · Leakage Monitoring

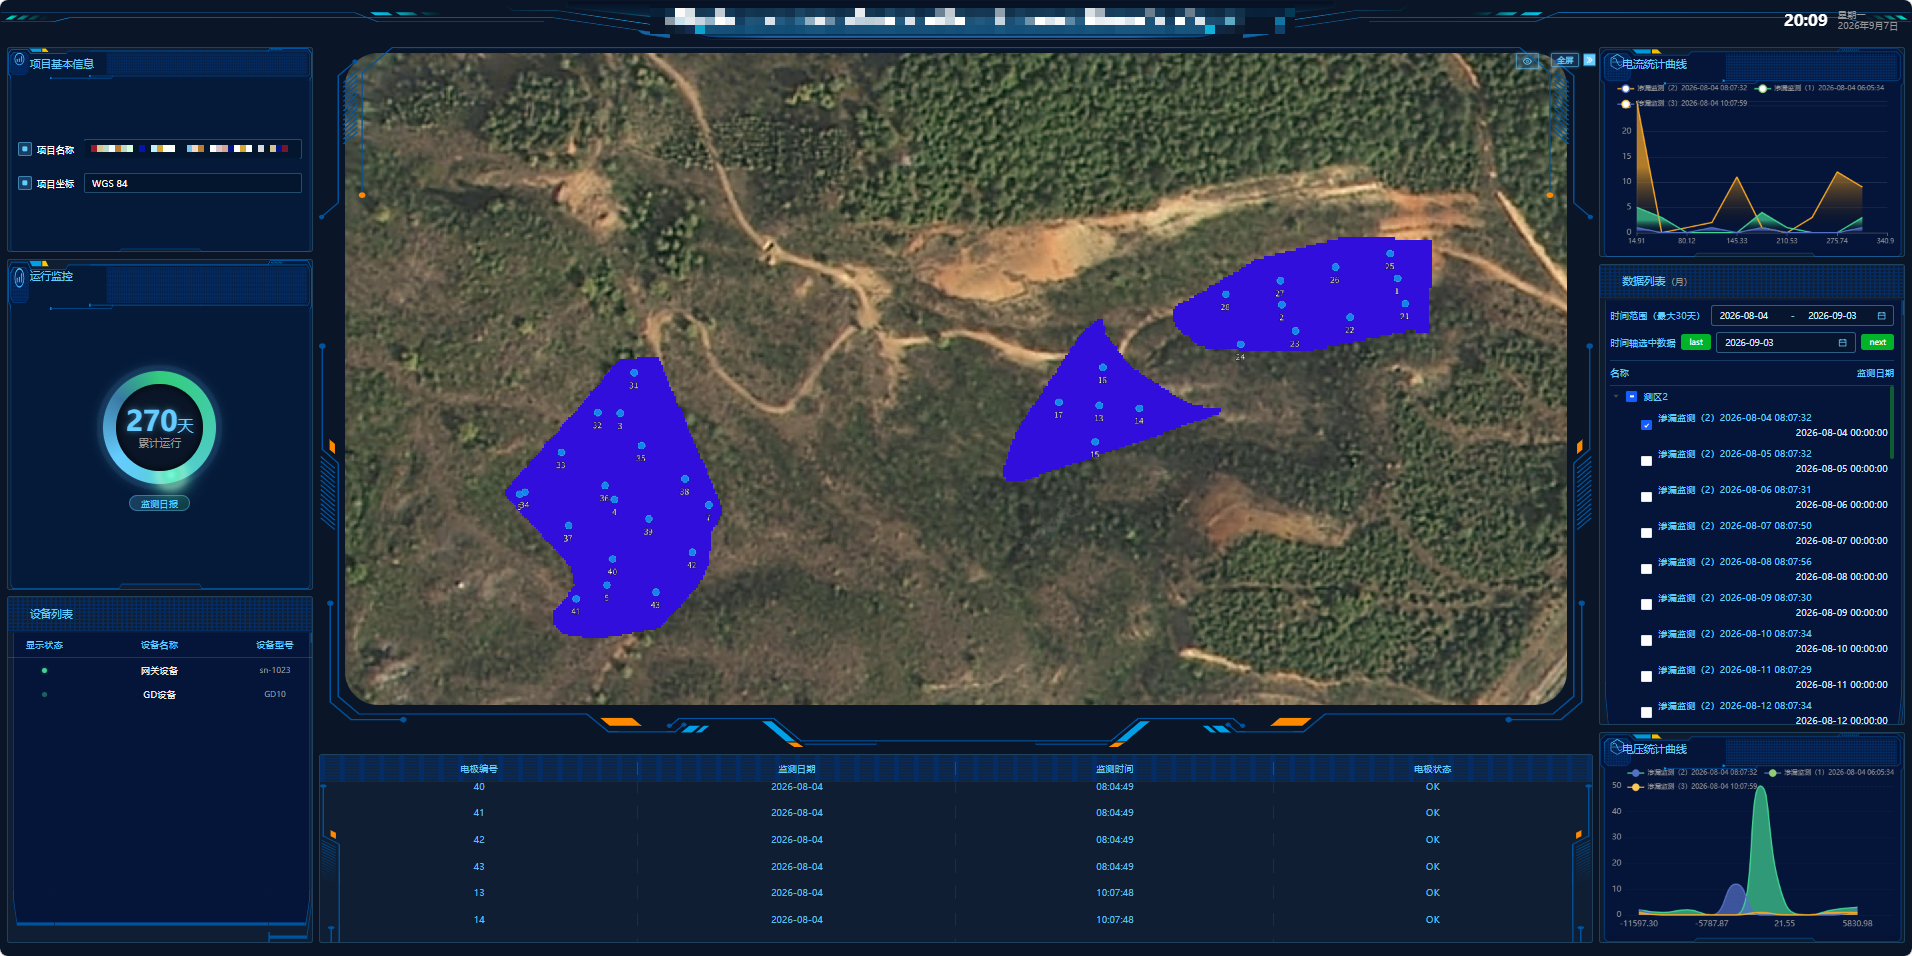
Leveraging the insulating property of HDPE liners and the electrical contrast between media above and below the membrane, our proprietary electric-field leakage-detection algorithm builds a fully automatic, high-precision landfill leakage monitoring system. Through artificial field construction and the acquisition and inversion of potential and resistivity data, it precisely determines the number and location of leaks and dynamically tracks the underground migration and spread of leachate. The system supports dynamic current-field modeling, simultaneous multi-point leak locating, unattended automatic operation, multi-level alerting, automatic daily/weekly reports, and regulatory dashboard integration. It deeply serves multiple large enterprises, outputs 3D current-density field visualization, and comprehensively safeguards landfill liner integrity and ecological stability.

  • HDPE electric-field algorithm

  • Simultaneous multi-point locating

  • 3D current density field

Gallery
Landfill leakage online monitoring dashboard
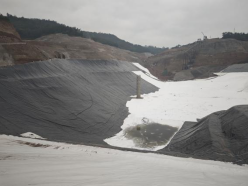
HDPE geomembrane installation at a landfill
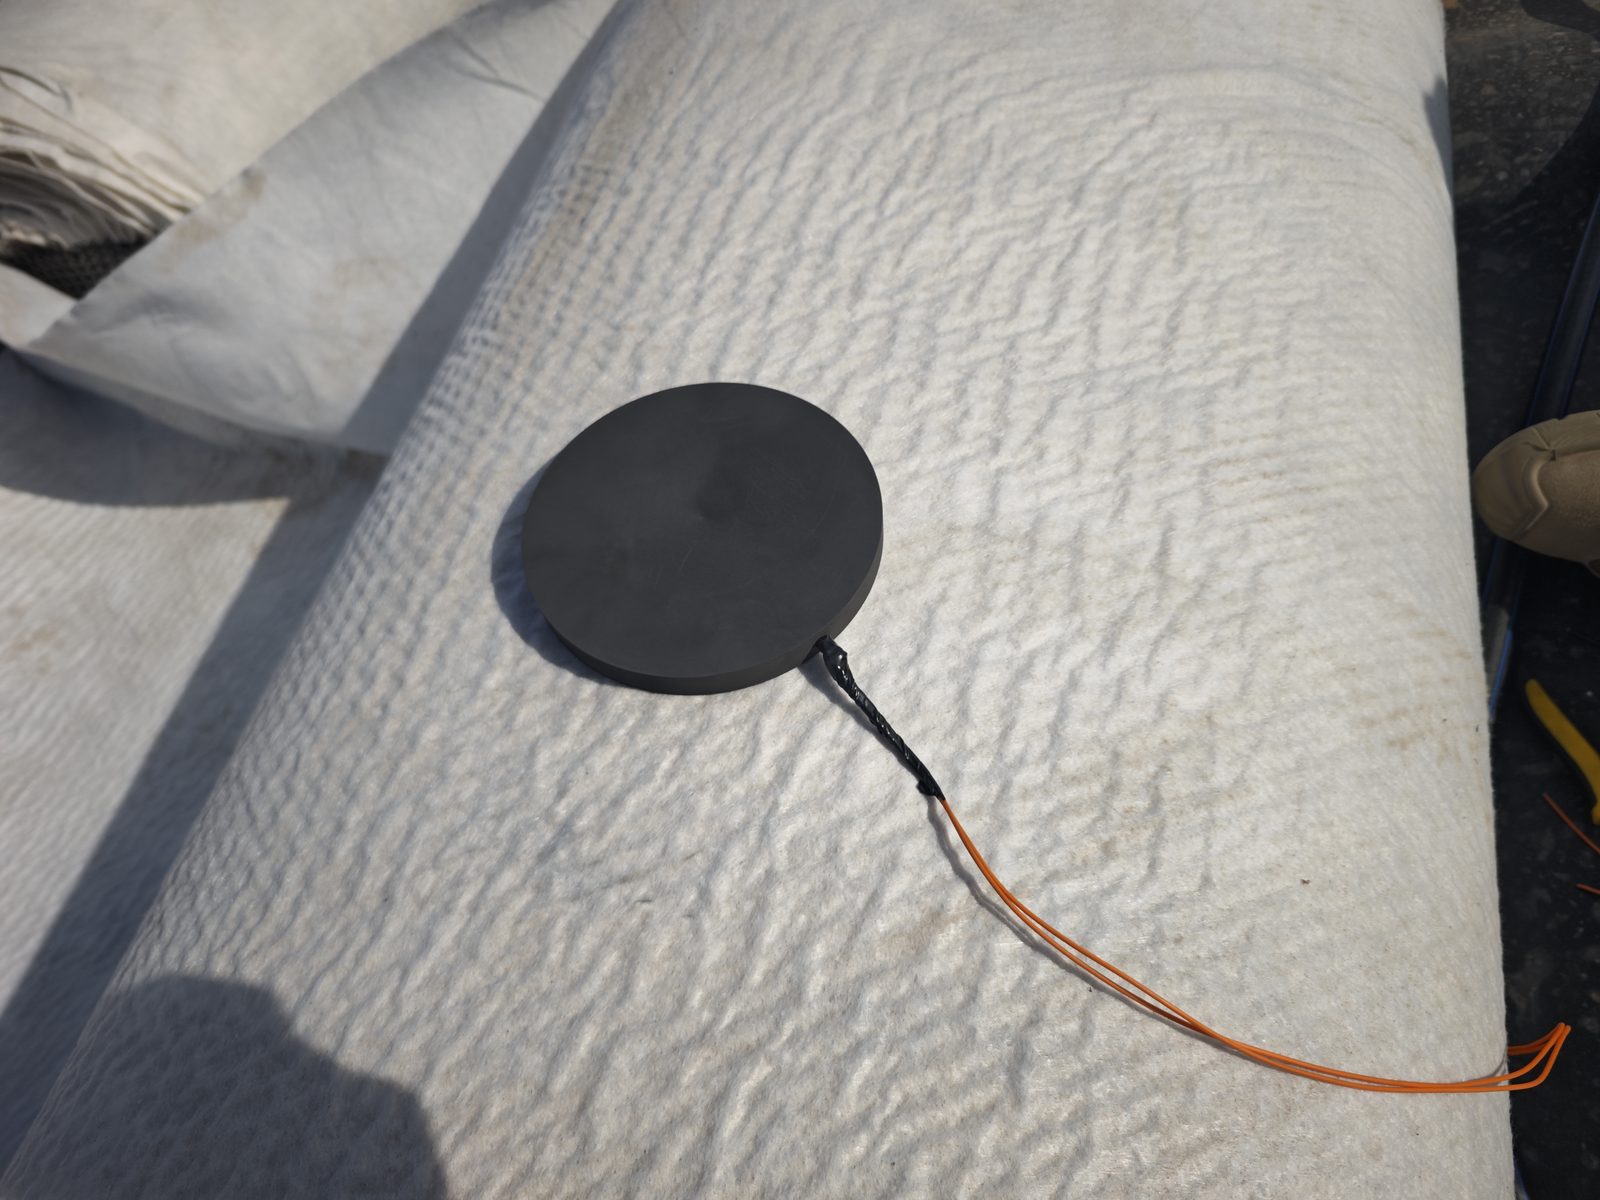
Monitoring electrodes beneath the landfill liner
Landfill leakage online monitoring dashboard
HDPE geomembrane installation at a landfill

Case 3 · Slope · Stability Monitoring

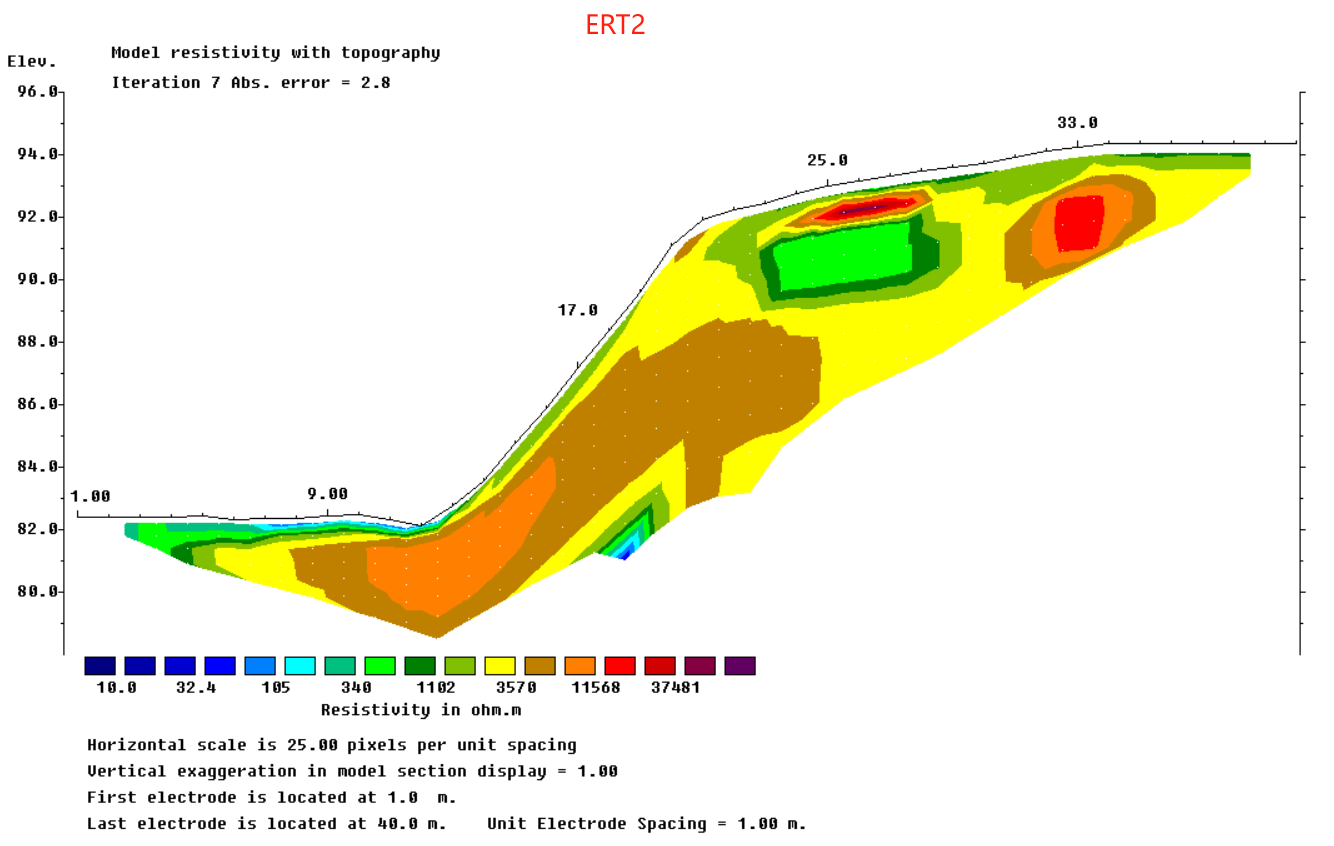
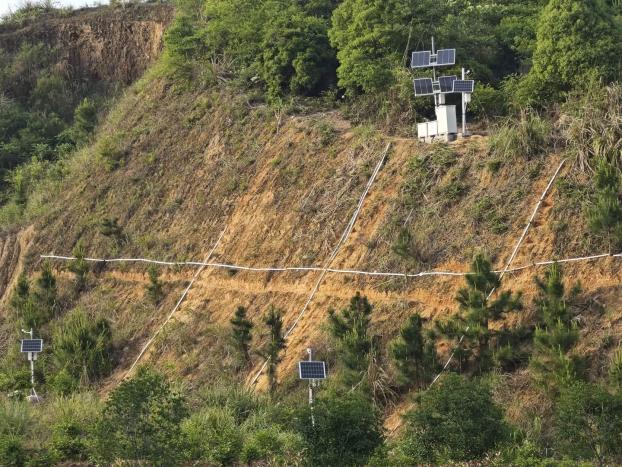
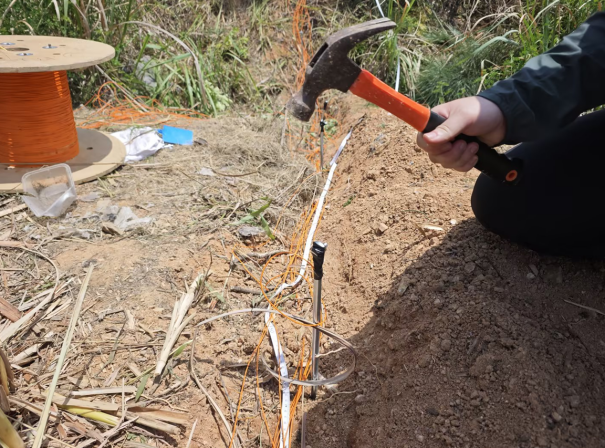
Mining and highway rock-soil slopes, affected by rainfall and stratum disturbance, are prone to crack development, interlayer softening, and sliding instability — precursors that develop at depth, beyond the reach of conventional surface monitoring. The system adapts to complex slope conditions with flexible hybrid cabling, fusing resistivity and passive-source velocity tomography (independent or joint inversion) to characterize subsurface structure and property changes at depth and precisely identify landslide precursors. It correlates GNSS displacement, seepage pressure, soil moisture, and tiltmeter data, and fuses historical geophysical inspection data into an integrated inspection-monitoring mode — comprehensively safeguarding long-term slope stability and safety.

  • Joint resistivity–velocity inversion
  • Hybrid cabling in complex terrain
  • GNSS · pressure · moisture · tilt correlation
  • Landslide precursor recognition
Gallery
Slope ERT resistivity inversion section with topography
Slope monitoring site: solar-powered station and cross-slope cabling
Electrode installation by driving on the slope
Slope ERT resistivity inversion section with topography
Slope monitoring site: solar-powered station and cross-slope cabling

Case 4 · Wastewater Ponds / Chemical Parks · Groundwater Contamination Monitoring

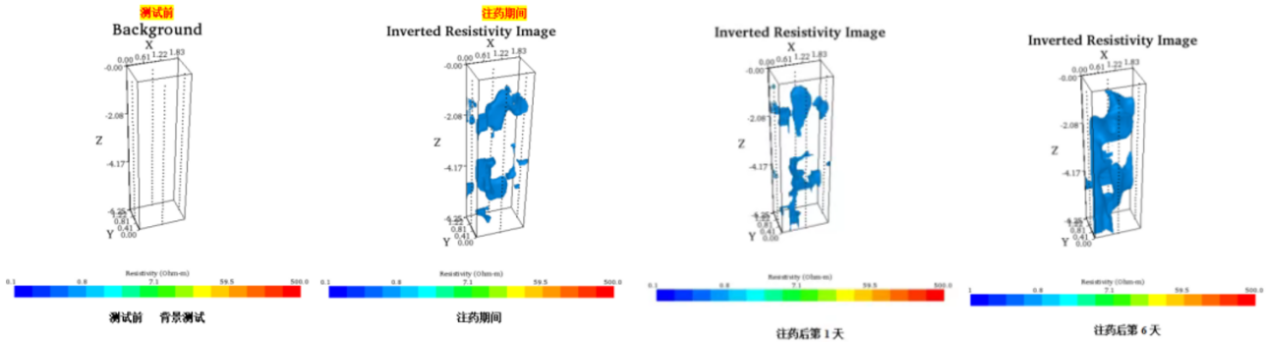
Groundwater contaminant spread beneath chemical parks and wastewater ponds is concealed and difficult to remediate; intermittent grab sampling misses early anomalies and cannot support dynamic source tracing or remediation control. The dedicated groundwater monitoring system runs fully automatically and unattended, correlating resistivity with oxidation-reduction potential to precisely characterize the space-time form of the contamination plume; coupled with reaction-transport models, it quantitatively inverts contaminant concentration and spread — upgrading from qualitative screening to quantitative diagnosis. It monitors the performance of chemical oxidation, pump-and-treat, and other remediation processes end to end, with platform integration and intelligent alerting: early warning of contamination, a trackable process, and quantifiable treatment.

  • Plume space-time characterization
  • Reaction-transport quantitative inversion
  • Remediation performance monitoring
  • ORP correlation
Gallery
3D time-lapse inversion of the contamination plume before, during, and after remediation injection
Monitoring cable and electrode array layout in a chemical park
Lowering borehole electrodes during drilling
3D time-lapse inversion of the contamination plume before, during, and after remediation injection
Monitoring cable and electrode array layout in a chemical park

Case 5 · Rare Earth Mine · Production Process Monitoring

In-situ leaching of ion-adsorption rare earths suffers from disordered leachant spread, mother-liquor loss, and low resource recovery — with geological and ecological risks, and no precise monitoring under experience-based construction. The system is tailored to the leaching process: resistivity profile imaging with time-series monitoring tracks leachant seepage paths and mother-liquor enrichment zones in real time and precisely delimits the leaching boundary, guiding refined injection and targeted recovery — effectively raising resource recovery while cutting reagent consumption and ecological risk. It serves a major enterprise, advancing intelligent, green, and standardized safe production in rare-earth mines.

  • Leachant seepage path tracking

  • Mother-liquor enrichment zoning

  • Guided precise injection & recovery

Gallery
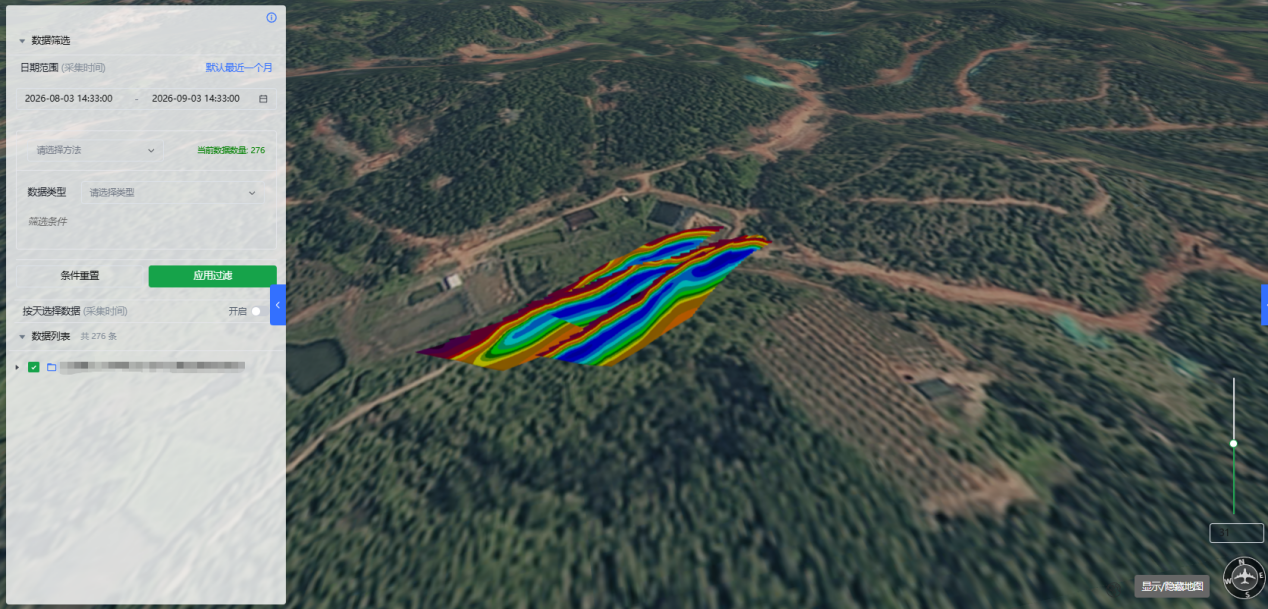
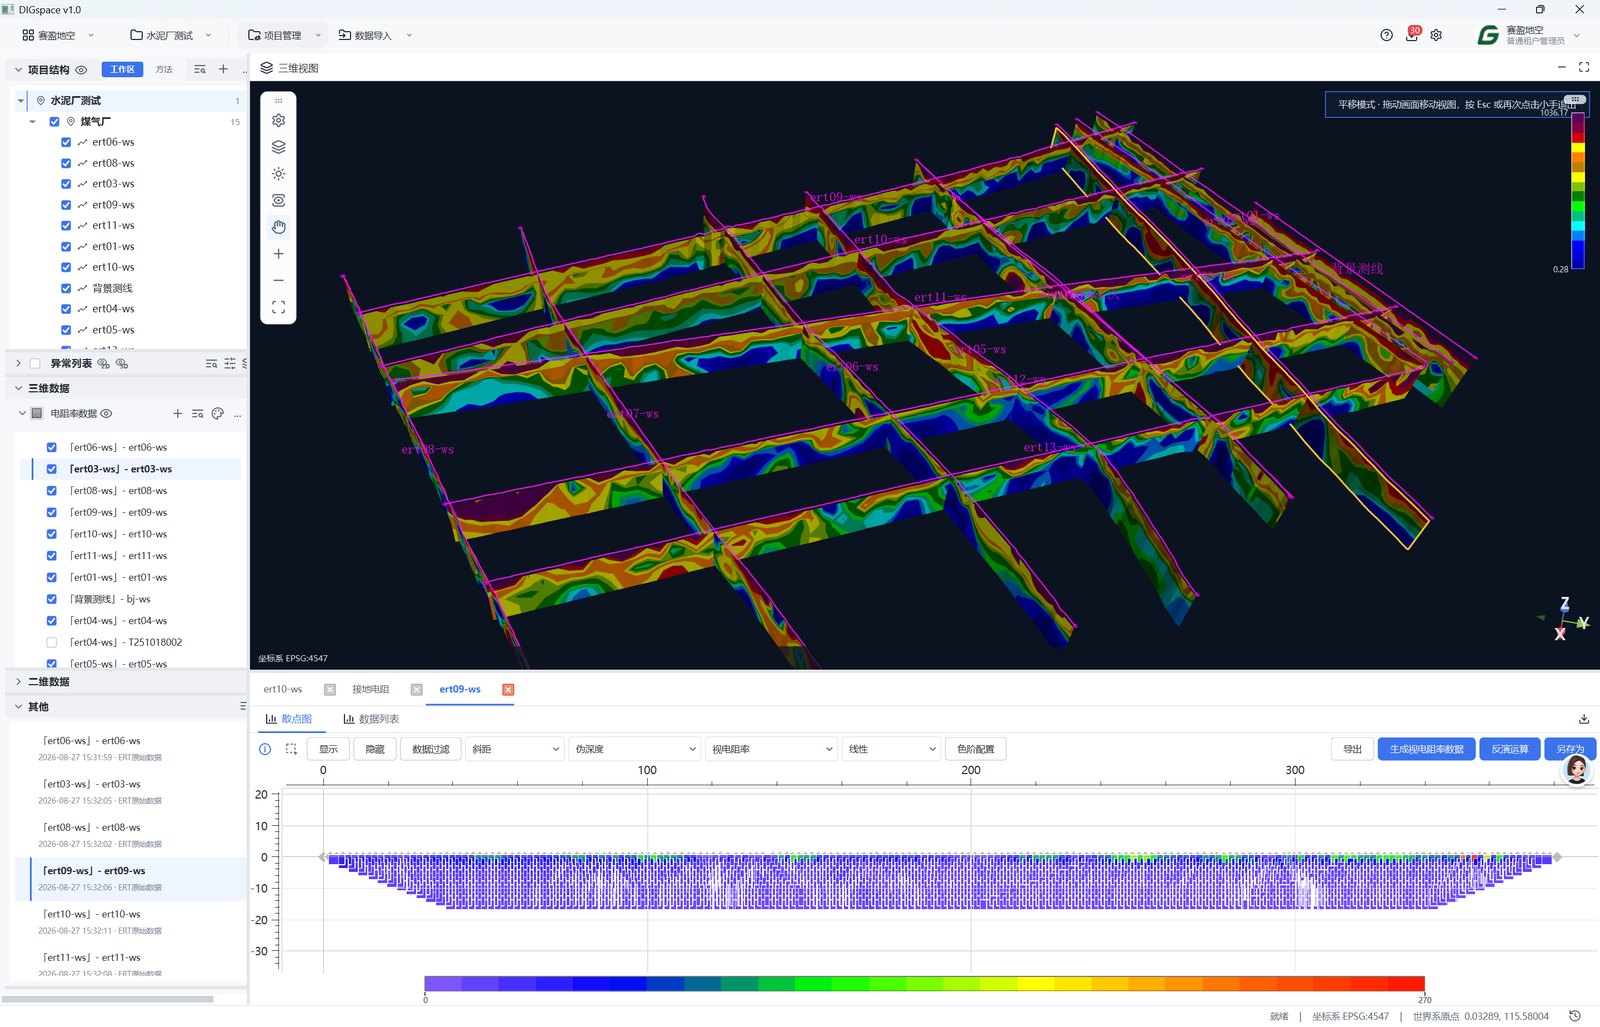
3D topographic multi-section resistivity inversion result across the rare-earth mining area
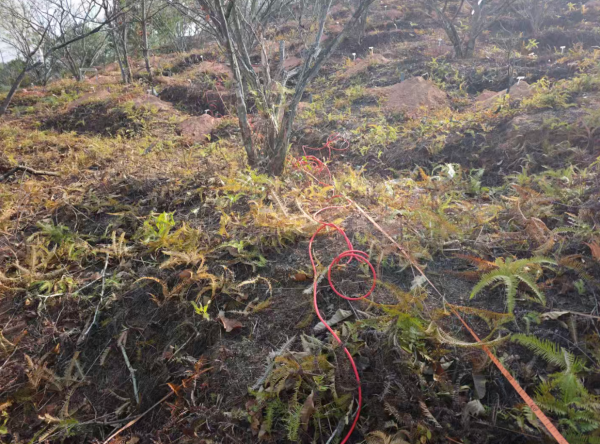
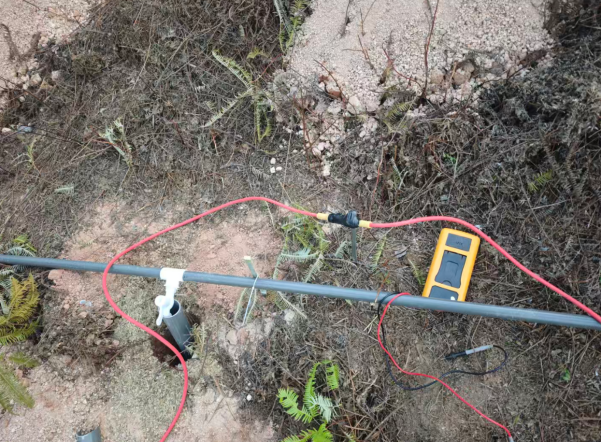
Electrode and cable layout at an ion-adsorption rare-earth leaching site
Monitoring electrodes and cable connections at an injection well
3D topographic multi-section resistivity inversion result across the rare-earth mining area
Electrode and cable layout at an ion-adsorption rare-earth leaching site