
Geomative
  • Products
    • Resistivity and IP Tomography
    • Electromagnetic
    • Integrated Well Logging System
    • Airborne and Ground Magnetometers
    • Subsurface Environmental Monitoring System
    GD-12/22/32 1/6/12-Channel Resistivity IP Imaging System

    GD-12/22/32 1/6/12-Channel Resistivity IP Imaging System

    GD22 It integrates modules such as transmission, collection, control and power supply, and possesses capabilities of high-power transmission, high-precision signal collection, full waveform recording, IP induced polarization measurement, etc. Combined with professional acquisition APP and Geometa data platform, it is suitable for various scenarios of electrical exploration operations. It has a high protection level and strong environmental adaptability, and can meet the detection requirements in multiple fields such as geology, engineering and environment.

    GS-30 12-Channel Electric Receiving Station

    GS-30 12-Channel Electric Receiving Station

    GD-10 Electrical Resistivity & IP Imaging System

    GD-10 Electrical Resistivity & IP Imaging System

    The GD10 survey system adopts a modular and scalable hardware platform, enabling the collection of electrical survey data in various scenarios such as on the ground, in tunnels, and underwater. This system has brought a technological breakthrough to traditional engineering geophysical survey operations.

    GD-20 Multi-channel ERT/IP Imaging System

    GD-20 Multi-channel ERT/IP Imaging System

    The multi-channel collection method is more efficient and significantly reduces the construction cost.

    Laboratory Electrical Workstation

    Laboratory Electrical Workstation

    Multi-electrode resistivity imaging for versatile subsurface investigations.

    Learn more
  • DIGspace
    • DIGspace
    • Platform Fundamental Ability
    • Technical Methods
    • Applications
    • trial application & download
    DIGspace Platform

    DIGspace Platform

    Integrating geological, geophysical, and monitoring data into a unified subsurface cognition system. Deep analysis on desktop, collaboration on web.

    A 3D geospatial platform fusing multi-source survey data with surface spatial information — covering exploration analysis and long-term monitoring.

    Learn more
  • Solutions
    • Mineral Resource Exploration
    • Online Monitoring
    • Cross‑hole investigation
    • Hydrogeological Survey
    • Engineering Geology Investigation
    • Subsurface Environmental Monitoring
    Brazil Gold Ore Exploration Case

    Brazil Gold Ore Exploration Case

    Carry out geophysical exploration for sulfate zones with potential metal mineral resources in ESTADO DO PARÁ, Brazil, and locate metal ore deposits by electrical prospecting technology.

    Underground water and mineral exploration at Beishan Lead-Zinc Mine, Hechi, Guangxi

    Underground water and mineral exploration at Beishan Lead-Zinc Mine, Hechi, Guangxi

    Integrated geophysical solutions for mineral prospecting.

    Learn more
  • Support
  • About Us
中文Talk to an Expert
  • Products
  • DIGspace
  • Solutions
  • Support
  • About Us
  1. Home
  2. DIGspace
  3. Technical Methods
  4. Ground Penetrating Radar (GPR)

Ground Penetrating Radar (GPR)

GPR · Electromagnetic method · Ground Penetrating Radar

Ground Penetrating Radar (GPR)

Multi-brand radar-format compatibility, node-based processing chains and GPS track QC — from import and processing to depth slices and 3D interpretation, with the DIGspot field app completing the anomaly re-survey loop.

Request a trial
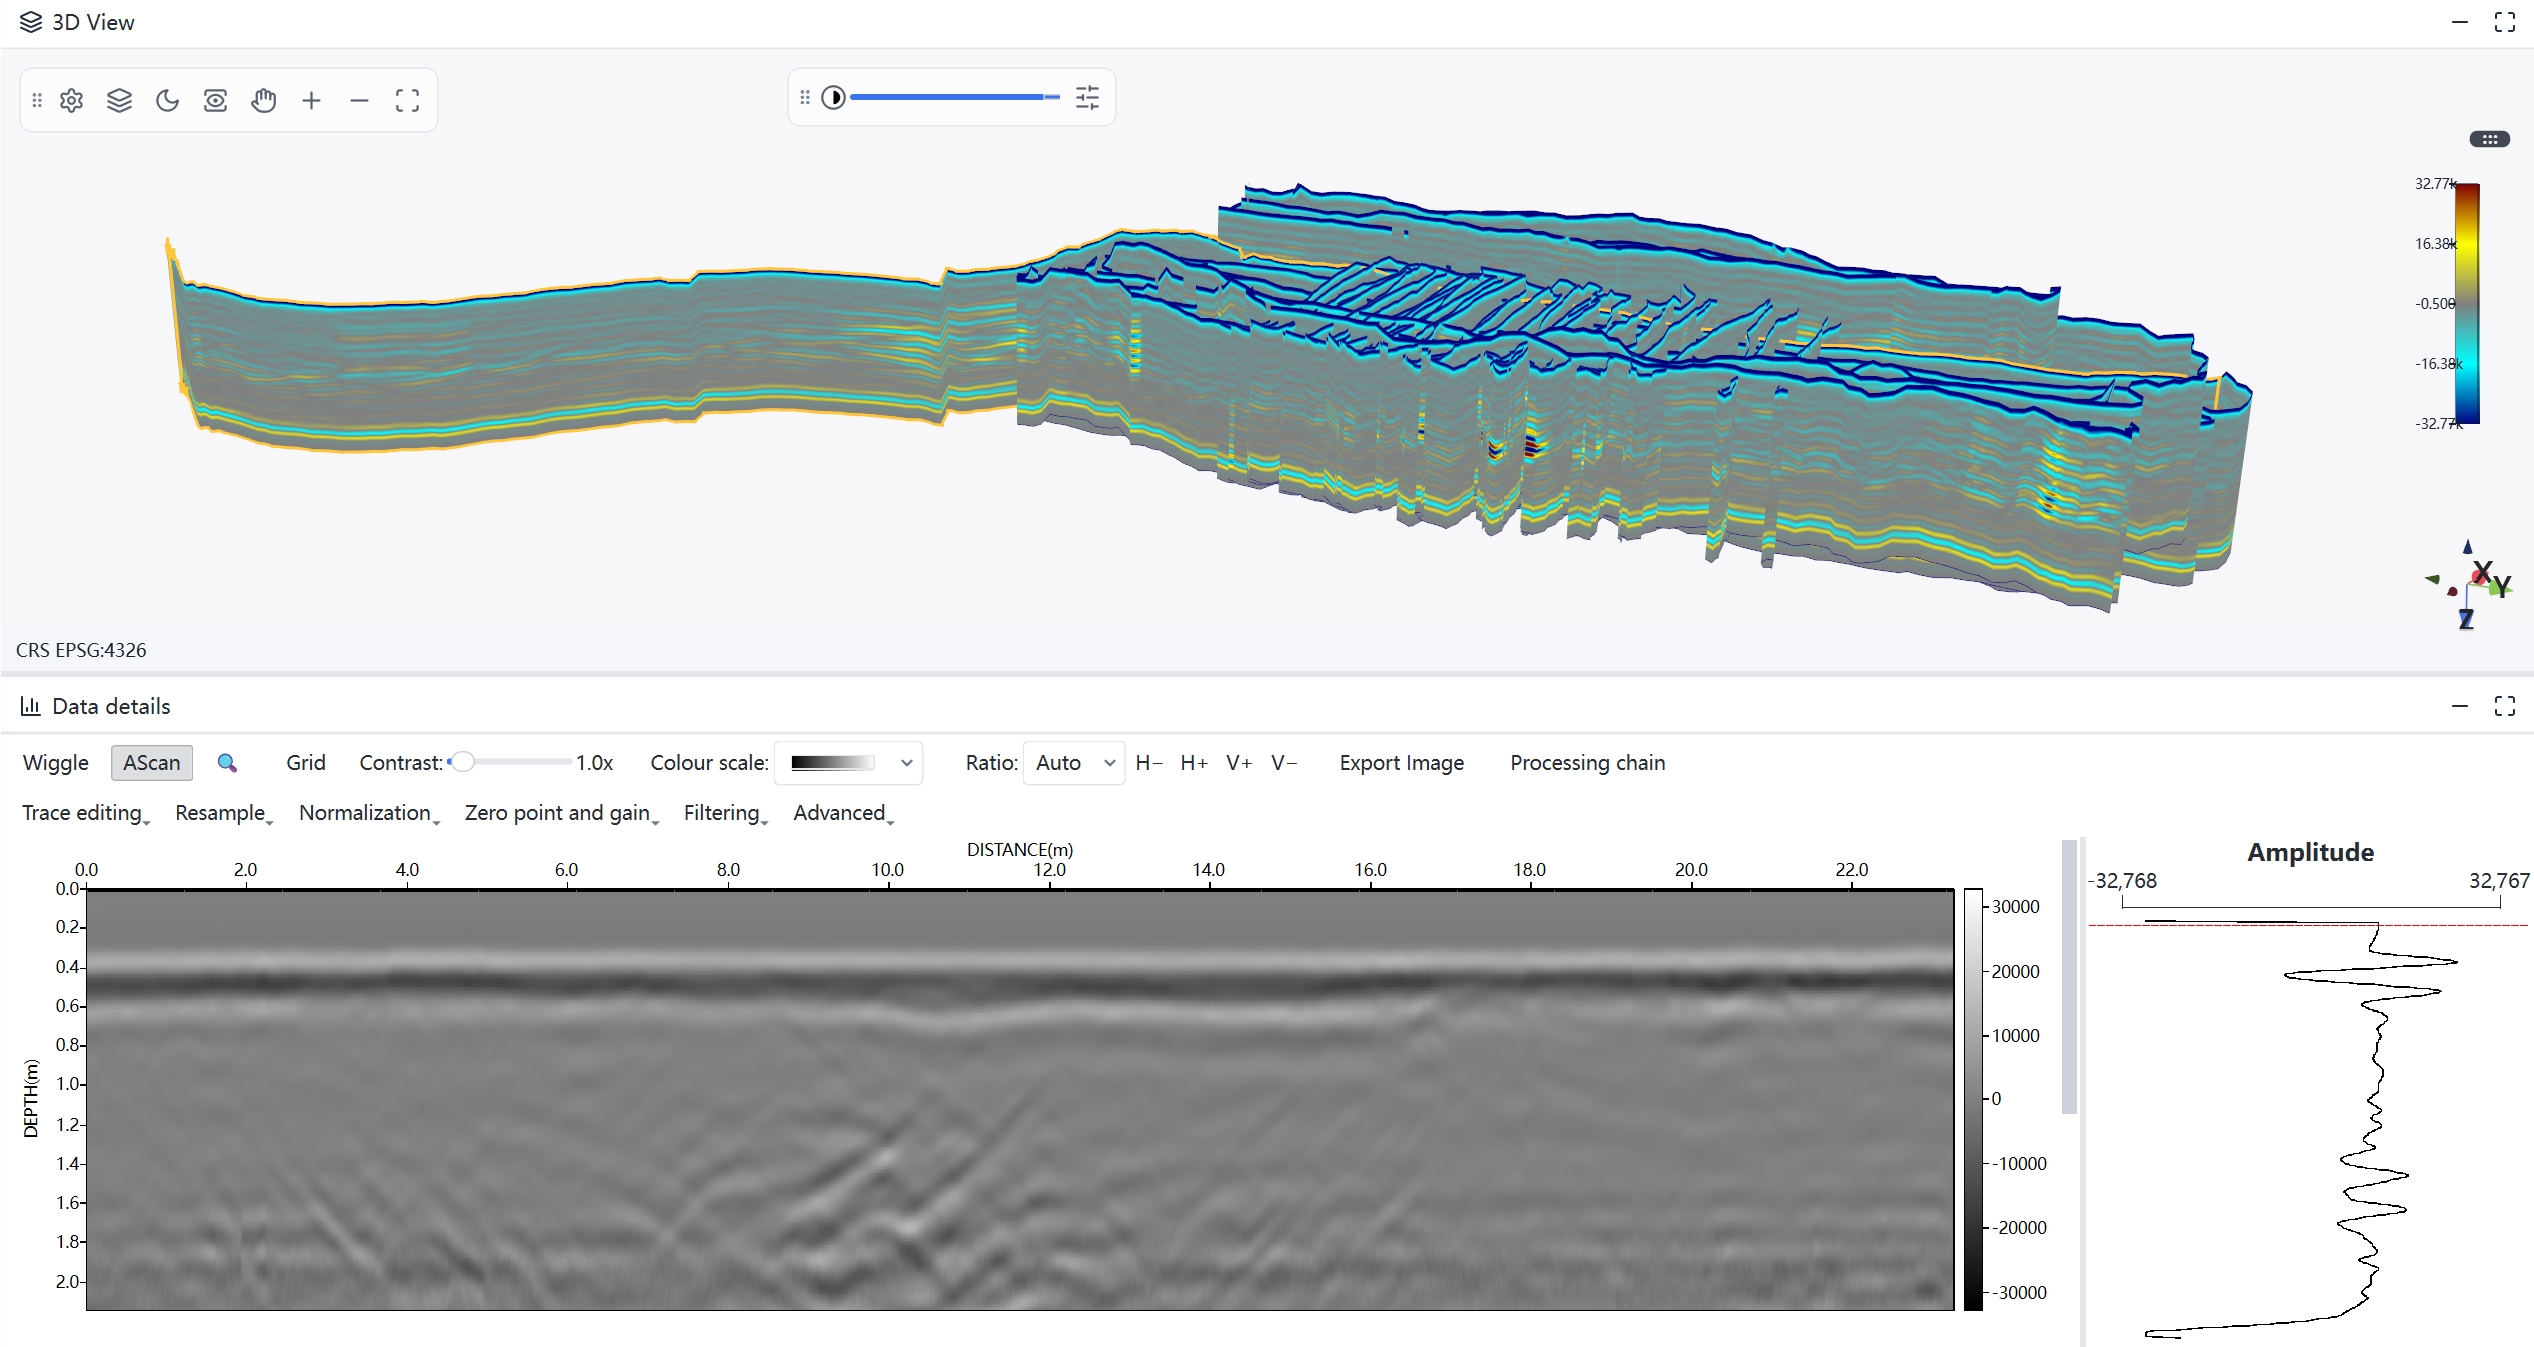
Overall working interface of the DIGspace radar module

Six core modules covering the full GPR data lifecycle

From data import to interpretation export, professional tools at every step — the content below unfolds in three tiers: Basics, Core and Highlights

1 Data import

Unified import for 8+ brand formats, automatic header parsing, 5 survey layout modes + 3 coordinate modes.

2 2D section view

B-scan browsing, X/Y axis switching, color-scale/contrast adjustment, wiggle plot and image export.

3 Node-based processing chain

20+ processing nodes freely combined — gain, filtering, migration, deconvolution and topographic correction fully covered.

4 GPS quality control

Node-based GPS processing chain: quality filtering → drift correction → spike repair → strong smoothing.

5 3D visualization

Depth slices, curtain sections, volume rendering and progressive LOD loading for smooth interaction with large datasets.

6 Anomaly detection and interpretation

Anomaly annotation, automatic target detection, horizon picking — results exported in one click.

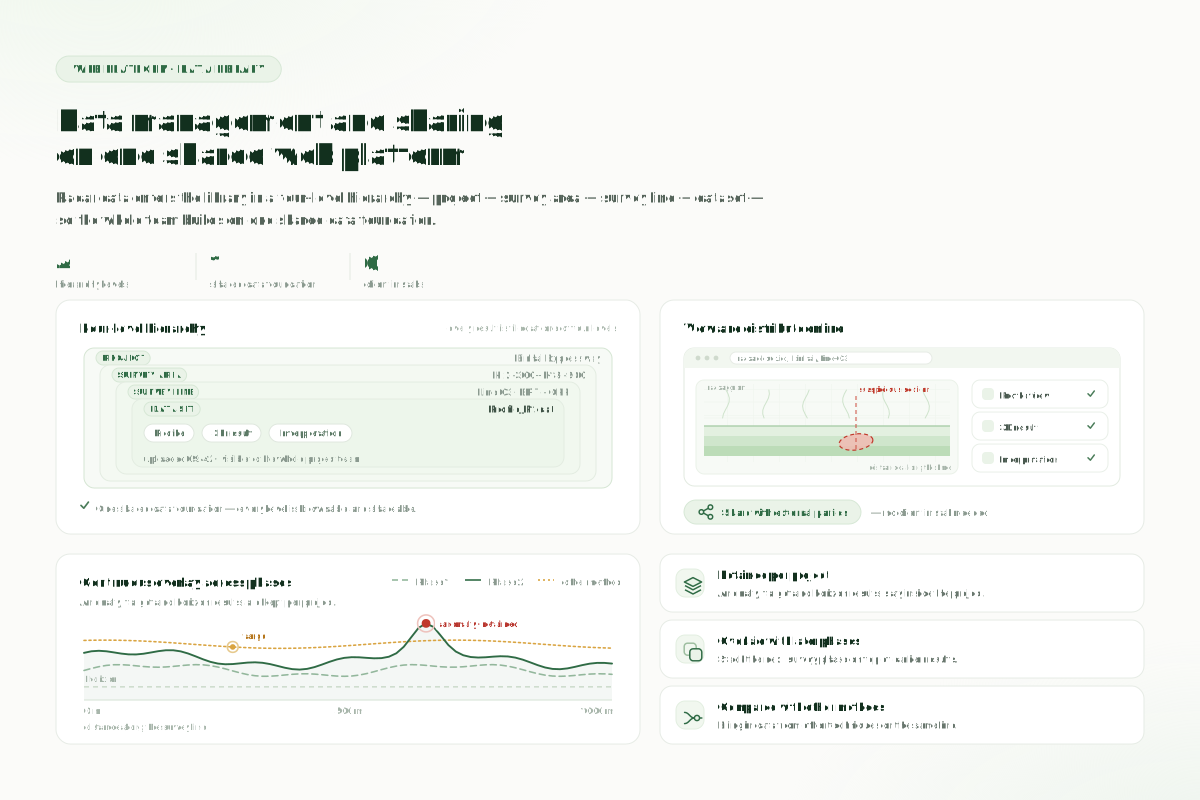
Four levels that organize every survey line clearly

Project → Survey Area → Survey Line → Dataset — an object tree that mirrors real project structure

  1. 🏢
    Project
  2. 🗺️
    Survey Area / Task
  3. 📏
    Survey Line
  4. 📦
    Radar dataset

Basics

Data comes in cleanly, profiles read clearly, tracks repair precisely — the complete fundamentals of radar processing software

Compatible with all major brands, ready out of the box

No longer locked to one equipment brand. DIGspace includes built-in parsers for 8+ major radar formats; data is recognized on import, automatically extracting sample count, time window, sampling interval, channel count and other key parameters. 5-step import:Select data source → Parse header → Configure parameters → Check survey lines → Start import 5 survey layouts:Unidirectional / orthogonal grid / angled / GPS track / vector curved 3 coordinate modes:Real engineering coordinates / local meter coordinates / project-relative coordinates
Format / BrandTypeDescription
DZT(GSSI)2D3DGSSI ground penetrating radar raw data; single-channel and multi-channel arrays supported
RD3 / RD7 / RAD(MALA)2D3DMALA single-channel / multi-channel array radar
IDS OGPR3DIDS STREAM multi-channel array radar
DT1(Sensors & Software)2DEKKO series data; antenna frequency and sampling parameters parsed automatically
IPRH / IPRB(IMPULSE)2D3DIMPULSE single-channel / multi-channel array radar
SGY / SEG-Y3D3DRADAR format; compatible with common third-party exported data
Normalized radar data2D3DThe platform's internal standardized format, consumed directly by the processing chain and visualization

Professional profile tools — what you see is what you get

From waveform browsing to frequency spectrum analysis, from color-scale adjustment to precise measurement — everything for B-scan profile analysis in one place

2D profile view for rapid data quality assessment

Dual display modes:Switch freely between wiggle (waveform) mode and grayscale mode to suit different reading habits Single-trace analysis:Select any trace to view its single-trace waveform and frequency spectrum, pinpointing reflection horizons and frequency characteristics Color-scale adjustment:Freely adjust color-scale range, contrast and opacity — even weak signals come through clearly Precise measurement:Multi-point distance, depth, time and area measurements; read anomaly dimensions and burial depth directly

GPS quality control: from poor-quality tracks to usable tracks

During acquisition, GPS signals suffer obstruction, loss of lock and multipath effects, and tracks frequently become anomalous; DIGspace's node-based GPS processing chain repairs them precisely.

  1. 🎚️
    Quality filtering
    Removes low-quality points by solution-status bitmask; thins by minimum spacing
  2. ↔️
    XY drift correction
    Repairs step-like XY offsets caused by GNSS signal loss
  3. ⛰️
    Spike repair
    Global plus local statistics detect elevation spikes; region-growing repair
  4. ~
    Strong smoothing
    Median + Gaussian + Savgol + uniform: four-stage combined filtering
GPS track before/after QC comparison

GPS track before / after QC · Left: raw track with obvious track spikes; right: smooth and continuous track after QC

Core

From the node-based processing chain to 4D results and anomaly interpretation — the results production system for radar data

Node-based processing chain — flexible and professional

Executes sequentially in units of "nodes," each node corresponding to one processing algorithm; nodes can be added/removed, reordered, enabled/disabled, configured and traced

20+ processing nodes, combined as needed

Parameters are adjustable at every step and the processing order is customizable. Parameter changes appear in live preview, and chains can be saved as templates for batch reuse. Time-zero correction · time-zero muting · zero-drift removal · background removal · gain (spherical spreading + absorption compensation + global factor) · intra-trace gain · integrated AGC gain Band-pass filter (2-FFT) · notch filter · profile smoothing · trace equalization · Hilbert envelope/phase · resampling Kirchhoff migration · predictive deconvolution · topographic correction (elevation static correction + Topo+Tilt) · muting · channel time-shift alignment · trace editing · profile reversal

Node-based processing chain interface · node library on the left + workflow canvas in the center + parameter panel on the right + live preview

4D visualization: from profiles to volume data

Depth slices, curtain sections, volume rendering and progressive LOD loading make the subsurface clear at a glance

GPR profiles and 3D volume data

Schematic · hyperbola responses on a GPR grayscale profile and 3D volume rendering (values shown are illustrative)

Depth slices

View depth slices at any depth along the survey line, with a real-time depth slider; contrast and color-scale bar adjustment are supported and images can be saved.

Curtain section

Multiple survey-line profiles stand upright at their true spatial positions, intuitively revealing the spatial distribution geometry of subsurface targets.

Volume rendering

Radar data volume rendering, with opacity and color bands highlighting target regions; clipping boxes can limit the display extent.

Progressive LOD loading

Large datasets load progressively in blocks to keep interaction smooth, with streaming display of batch data supported.

Depth slice C-Scan

Depth slice (C-Scan) · step through horizontal slices layer by layer for reconnaissance of anomalous bodies and their planar distribution

Anomaly detection and interpretation · accumulating knowledge on top of data

Make every anomaly traceable, manageable and exportable

Anomaly annotation

Mark anomaly regions on sections and in 3D views, recording type, description and confidence, with classified management and search.

Automatic target detection

Automatically recognizes pipes, cables, cavities and other underground targets from hyperbolic signatures, generating a candidate-target list.

Horizon picking

Pick reflective horizons (interfaces / strata) interactively: horizon lines are generated with editing and statistics, and results export in one click for report drafting and 3D-scene overlay.

Highlights

More than standalone processing software — three-way collaboration across Desktop, Web and the DIGspot field app, with platform-level power from cross-method integration

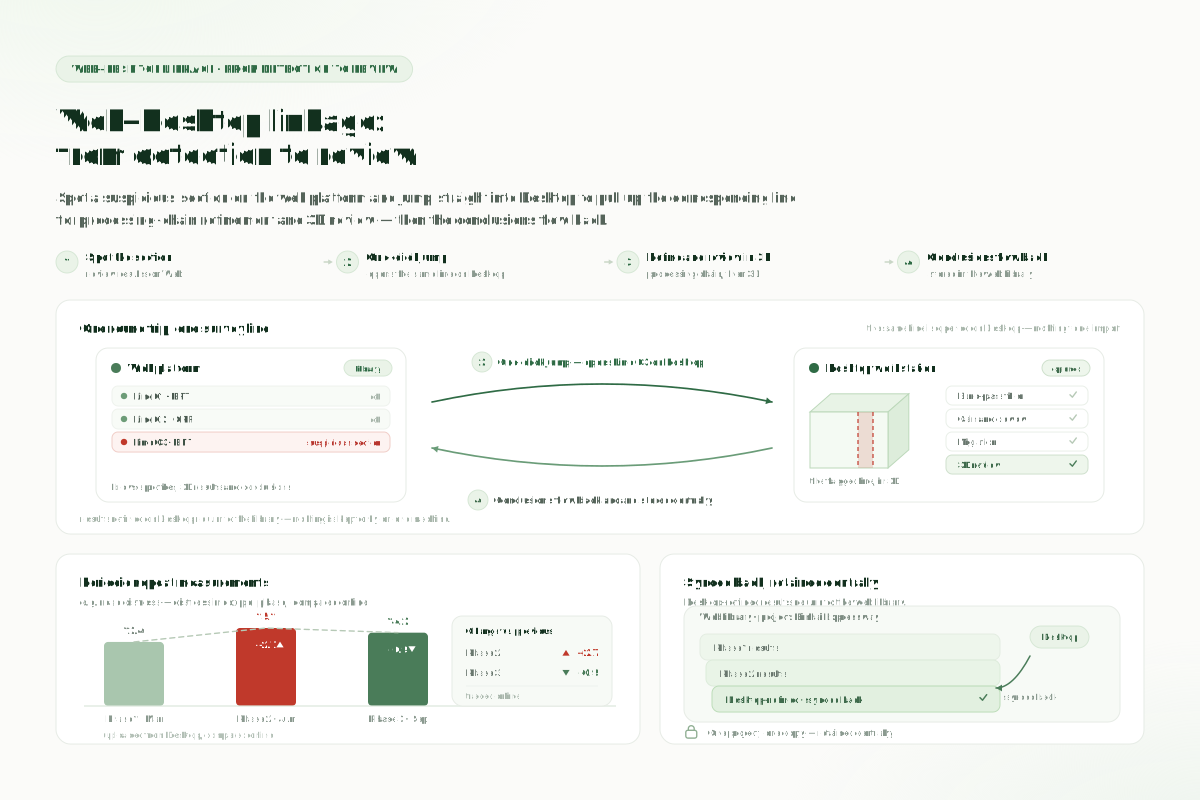
Web × Desktop: the team collaboration loop for radar data

Desktop handles processing and interpretation; the Web platform handles data management, results sharing and task distribution; both share one data foundation

The DIGspot field app: full traceability from anomaly detection to verification

An anomaly marked on Desktop becomes a field task in one click: navigate to site, re-survey and verify on site, take photos and videos, record offline, upload and retain — office and field close the loop on one platform

  1. 📥
    Receive tasks
    Platform anomalies sync to the phone; view the list by project with four-color risk-level markers
  2. 🧭
    Navigate to site
    View anomaly positions on the map; one click launches route guidance straight to the site
  3. 📝
    Re-survey & verify
    Re-survey conclusions + true / false anomaly determination; excavation / drilling / radar re-scan; on-site photos and video
  4. ☁️
    Upload & close the loop
    Store offline, sync automatically when connected; status flow and results are fully traceable

Eight steps to a closed loop, from import to deliverables

A standardized operating procedure so every data processing job has a clear playbook

  1. 1
    Data import
    Select format → configure parameters → check survey lines — import to library in 5 steps
  2. 2
    Data organization
    Confirm the project / task / survey-line hierarchy and metadata
  3. 3
    Initial profile review
    Browse B-scans to quickly assess data quality
  4. 4
    Data processing chain
    Background removal → gain/AGC → filtering → migration
  5. 5
    GPS quality control
    Quality filtering → glitch/drift/spike repair → smoothing
  6. 6
    3D visualization
    Review across slices / curtain sections / volume rendering
  7. 7
    Interpretation & annotation
    Anomaly annotation / target detection / horizon picking
  8. 8
    Results export
    Multi-format output of images, data and interpretation results

GPR · Typical applications

High-frequency high resolution, non-contact and non-destructive, vehicle-mounted rapid surveying — GPR is irreplaceable in shallow subsurface investigation. Below are the pain points, method configurations, deliverables and cases for typical scenarios.

Road Defect Inspection

Pavement voiding, loose base, subgrade settlement · vehicle-mounted rapid reconnaissance + 3D-located distress GPR 3D volume rendering Vehicle-mounted survey Specialty · Periodic

Tunnel Look-Ahead Prediction

Adverse geology detection ahead of the tunnel face · joint forecasting with ERT, shallow and deep complementing GPR ERT Joint interpretation Investigation · Along the construction schedule

Engineering Investigation

Detection of underground utilities, structures and shallow voids · integrated multi-method surveys raise both efficiency and precision GPR ERT Borehole data Investigation · Project-based

Archaeology

Non-contact, non-destructive investigation · reveals the layout and burial depth of subsurface archaeological remains without excavation GPR Depth slices Non-destructive preservation Specialty · Project-based

3D Modeling & Spatial Analysis

Radar 3D volumes fuse with borehole and electrical-method data into durable, reusable 3D digital assets GPR Multi-source fusion Digital assets Value-added · Long-term

Frequently asked questions about GPR

Currently supported: GSSI (DZT), MALA (RD3/RD7/RAD), IDS (OGPR), EKKO (DT1), IMPULSE (IPRH/IPRB), 3D-Radar (SEG-Y), plus Geomative's own standardized format — 8+ major brands in total, covering essentially the common equipment on the market. If you have other format needs, contact us to evaluate a format extension.
The chain executes sequentially in units of "nodes," each node corresponding to one processing algorithm (such as time-zero correction, background removal or band-pass filter). Nodes can be added or removed, reordered, and enabled/disabled individually, with independent parameter configuration per node. Parameter changes update the live preview. A chain can be saved as a template and reused on similar data in one click, including batch application to multiple survey lines.
During field acquisition, GPS signals are often affected by obstruction, loss of lock and multipath, producing anomalous points, glitches, drift and step offsets in the track — directly undermining the spatial positioning accuracy of radar profiles. DIGspace's GPS processing chain provides four core nodes — quality filtering, XY drift correction, spike repair and strong smoothing — that progressively repair poor-quality tracks into high-quality positioning data.
DIGspace provides four 3D visualization modes: (1) depth slice (C-Scan) — horizontal slicing along the depth direction; (2) curtain section (Curtain) — multiple survey-line profiles displayed upright at their true spatial positions; (3) volume rendering (Volume) — full data-volume rendering with opacity adjustment and clipping; (4) progressive LOD loading — block-by-block streaming for large datasets. The four modes switch freely, and depth color bands stay linked with the 2D profiles.
Yes. Once configured, a chain can be saved as a named template and loaded and applied to other datasets in one click. The GPS processing chain also offers an "apply to all lines" function that batch-processes track data across multiple survey lines, greatly improving efficiency.
DIGspace uses progressive Level of Detail (LOD) loading: in large-dataset scenarios, data streams in blocks to keep interaction smooth. Performance can be further optimized by narrowing the display extent or using depth slices rather than full-volume rendering.
Divide the work by depth: GPR is high-frequency and high-resolution but shallow-penetrating (typically 0–10 m), suited to targets such as utilities, voiding and shallow archaeological remains; ERT has somewhat lower resolution but reaches tens to over a hundred meters, suited to overall stratigraphic structure and water conditions. On real projects, GPR typically runs rapid reconnaissance to locate suspicious sections, then ERT fills in the deep structure; the two results are registered and overlaid in one DIGspace 3D scene for joint interpretation.
GPR is currently processed and interpreted mainly on Desktop, while the Web platform handles project/line data management and online results viewing and sharing. For periodic repeat measurements (such as regular road distress surveys), results from each phase can be uploaded and compared online. However, direct device acquisition and automatic cloud processing are currently more complete on the ERT side.
DIGspot is the companion field mobile app for DIGspace, carrying the re-survey and verification of anomalies: after anomalies interpreted and marked on Desktop sync to the app, field crews view anomaly lists and risk levels by project, navigate to sites on the map, enter a re-survey conclusion (Normal / Abnormal / Needs re-check) and a verification conclusion (confirmed anomaly / false anomaly; verification methods include excavation verification, drilling and repeat GPR survey), and capture photos and videos as supporting evidence. When there is no network in the field, data is cached on the phone and auto-syncs back to the platform once online; anomaly status and results stay consistent across Desktop, Web and mobile, forming a traceable Detect — Re-survey — Verify — Deliver closed loop.

Frequently asked questions about GPR

Want the full GPR processing capability?

Book a one-to-one demo and see how DIGspace handles your radar data

Request a 30-day trial
Geomative

A provider of spatial intelligence technology and equipment, serving surveying, energy, transport and emergency response with fully self-developed hardware and software.

Products

  • Resistivity and IP Tomography
  • Electromagnetic
  • Integrated Well Logging System
  • Airborne and Ground Magnetometers
  • Subsurface Environmental Monitoring System

Industries

  • Mineral Resource Exploration
  • Online Monitoring
  • Cross‑hole investigation
  • Hydrogeological Survey
  • Engineering Geology Investigation
  • Subsurface Environmental Monitoring

Service & Support

  • Knowledge Base
  • FAQ
  • Document Downloads
  • Drivers & Software
  • Warranty Policy
  • Contact Support

copyright@2026 Geomative Co., Limited

Privacy PolicyTerms of UseSitemap