

Informal garbage landfills refer to those that have not been approved in terms of land use, planning, project approval, environmental protection, etc., and have not been designed and constructed in accordance with the normative standards for the construction of garbage sanitary landfills. Its main hazards include waste of land resources, organic matter, heavy metals, multiple pollution by pathogenic microorganisms, landfill gas pollution, methane combustion explosion risks, and soil and groundwater pollution risks.
As one of the main sources of soil pollution, informal landfills can be treated and repaired not only to improve the urban environment, but also to provide more land resources and environmental capacity for urban development, and more importantly, to eliminate the risk of soil and groundwater pollution through governance.
We were commissioned to carry out geophysical survey work on an informal landfill. At present, it is known that the landfill has been filled with municipal solid waste since 2003, and was simply covered with soil until 2018. It is urgent to carry out high-density electrical resistivity (ERT) investigation on the landfill to determine the landfill range and boundary, and to provide a reliable scientific basis for the environmental investigation and restoration of the landfill
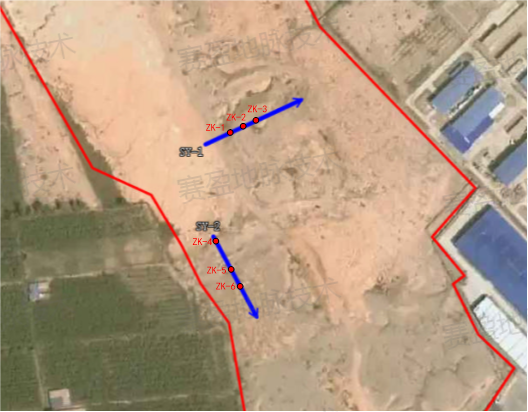
Firstly, conduct a feasibility test in the survey area to confirm the measurement parameters used in the later survey work. Two sections were selected for the test, namely SY1 and SY2. The two sides of SY1 are the original strata, and the middle part is the site known to have landfill; the left side of SY2 is the original stratum, and the right side is the site known to have landfill. Each site is measured by Saiying Wenner-Schlumberger (hereinafter referred to as Saiying WS device), Dipole-Dipole and Edge-Gradient. At the same time, 6 boreholes (ZK1~ZK6) are arranged on the test measuring line.

Fig. 2 The location map of test survey line and physical property acquisition drilling


Fig. 3 The location map of test survey line and physical property acquisition drilling
It can be seen from the figure that the WS device can better describe the shape of landfill waste. The layout of the ERT survey line is based on the previous EM detection results and site terrain conditions, and the detection parameters are based on the feasibility test. A total of 28 ERT measuring lines were laid out in this survey. The Wenner-Schlumberger Array method was used for testing. The total length of the measuring lines is 11580 m, and the electrode distance is 2.4m. In the area, multiple encrypted survey lines are laid out along the edge.

Figure 4 Survey area and ERT survey line layout
In order to fully understand the site stratum, landfill resistivity, etc., the site background should be detected first before the investigation of the landfill situation. The background survey line is laid out in the area (ERT15) where non-landfill waste is confirmed in the survey area, and the area (ERT25) that crosses landfill and non-landfill areas.

Fig.5 Profile diagram of ERT15 resistivity contour of background measuring line

Fig. 6 Profile diagram of the ERT25 resistivity contour of the background measuring line
By analyzing the difference in resistivity between the landfill area and the non-landfill area, it can be seen that the landfill area is relatively lower in resistivity than the background area, forming a low-resistance abnormal contour gradient zone.
The following are some representative measuring line resistivity contour profile results.

Fig. 7 Profile map of ERT4 resistivity contour line and geological interpretation map

Fig. 8 Profile map of ERT5 resistivity contour line and geological interpretation map

Fig. 9 Comparison map of resistivity contour profile of measuring line ERT6 and drill core, geological interpretation map

Fig. 10 Photos of drill core samples
Combining all the profile data, through the two-dimensional interpolation function, the main landfill range and boundary of the garbage in the survey area can be obtained.

Figure 11 Scatter distribution map of resistivity in survey area
By adopting the high-density resistivity survey method in the landfill, the boundary and scope of the landfill have been ascertained, and the feasibility of using the method of drilling and geophysical prospecting to investigate the landfill site has been verified. Provide a reliable scientific basis for environmental investigation and restoration.
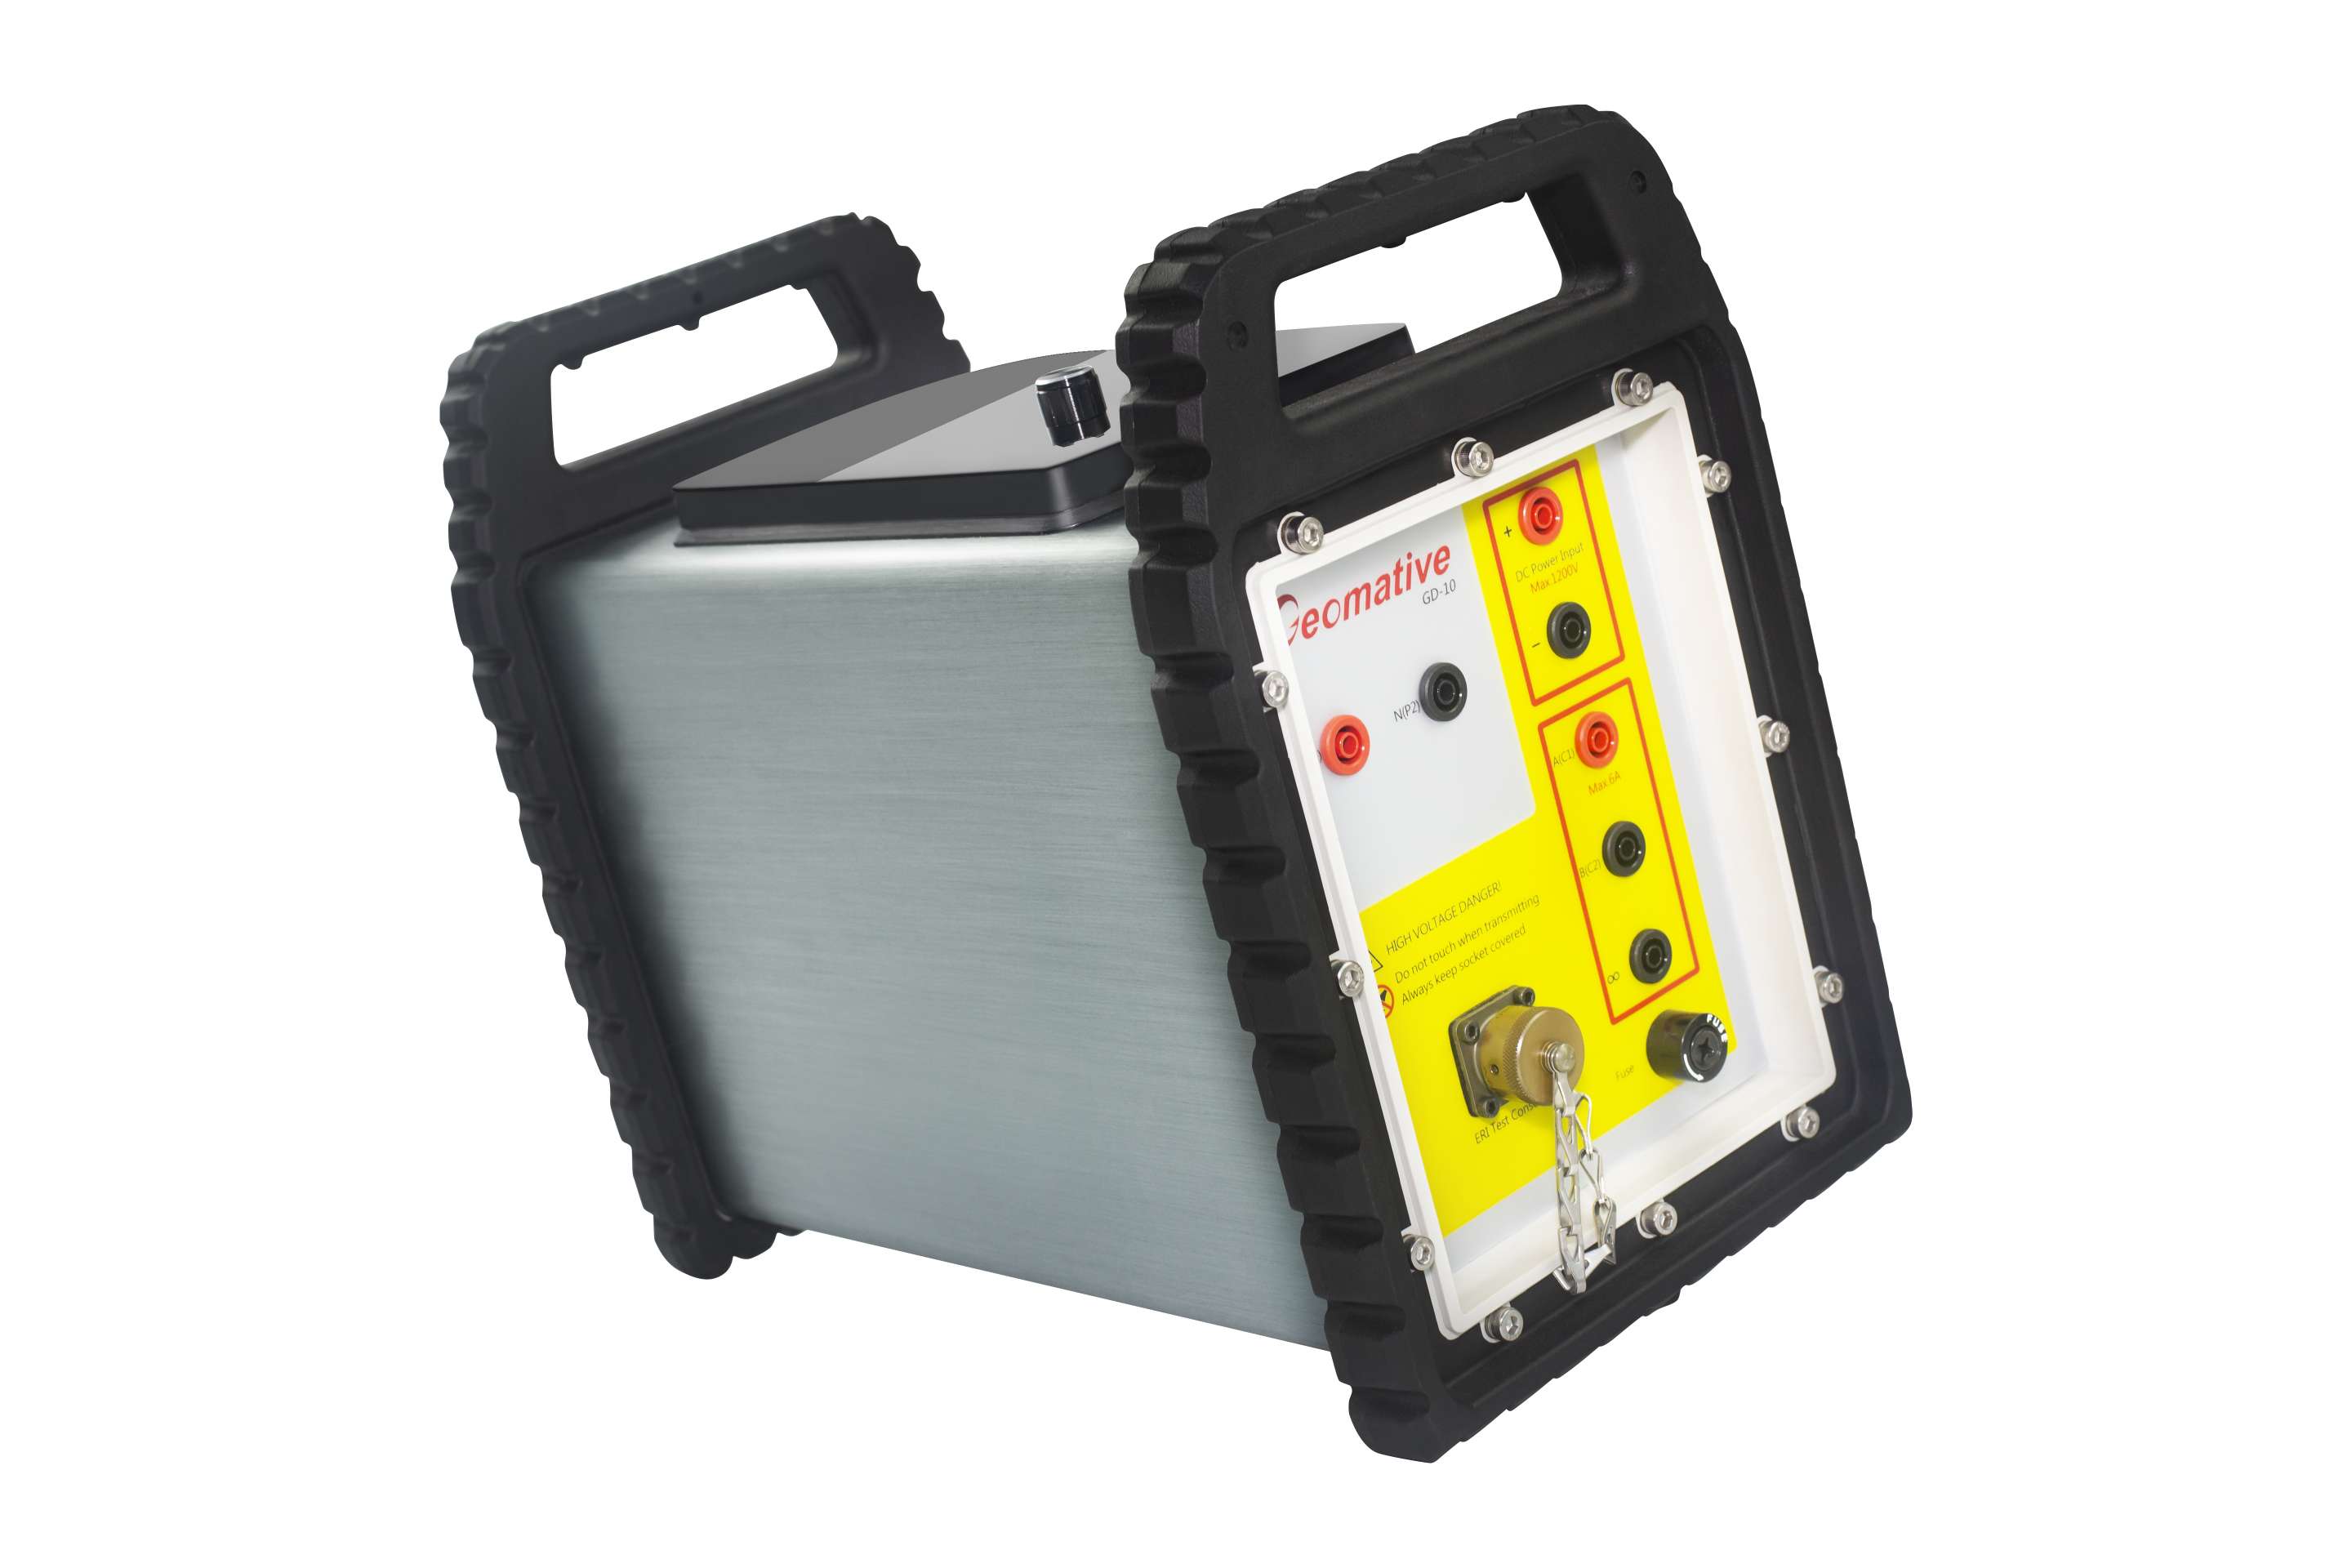
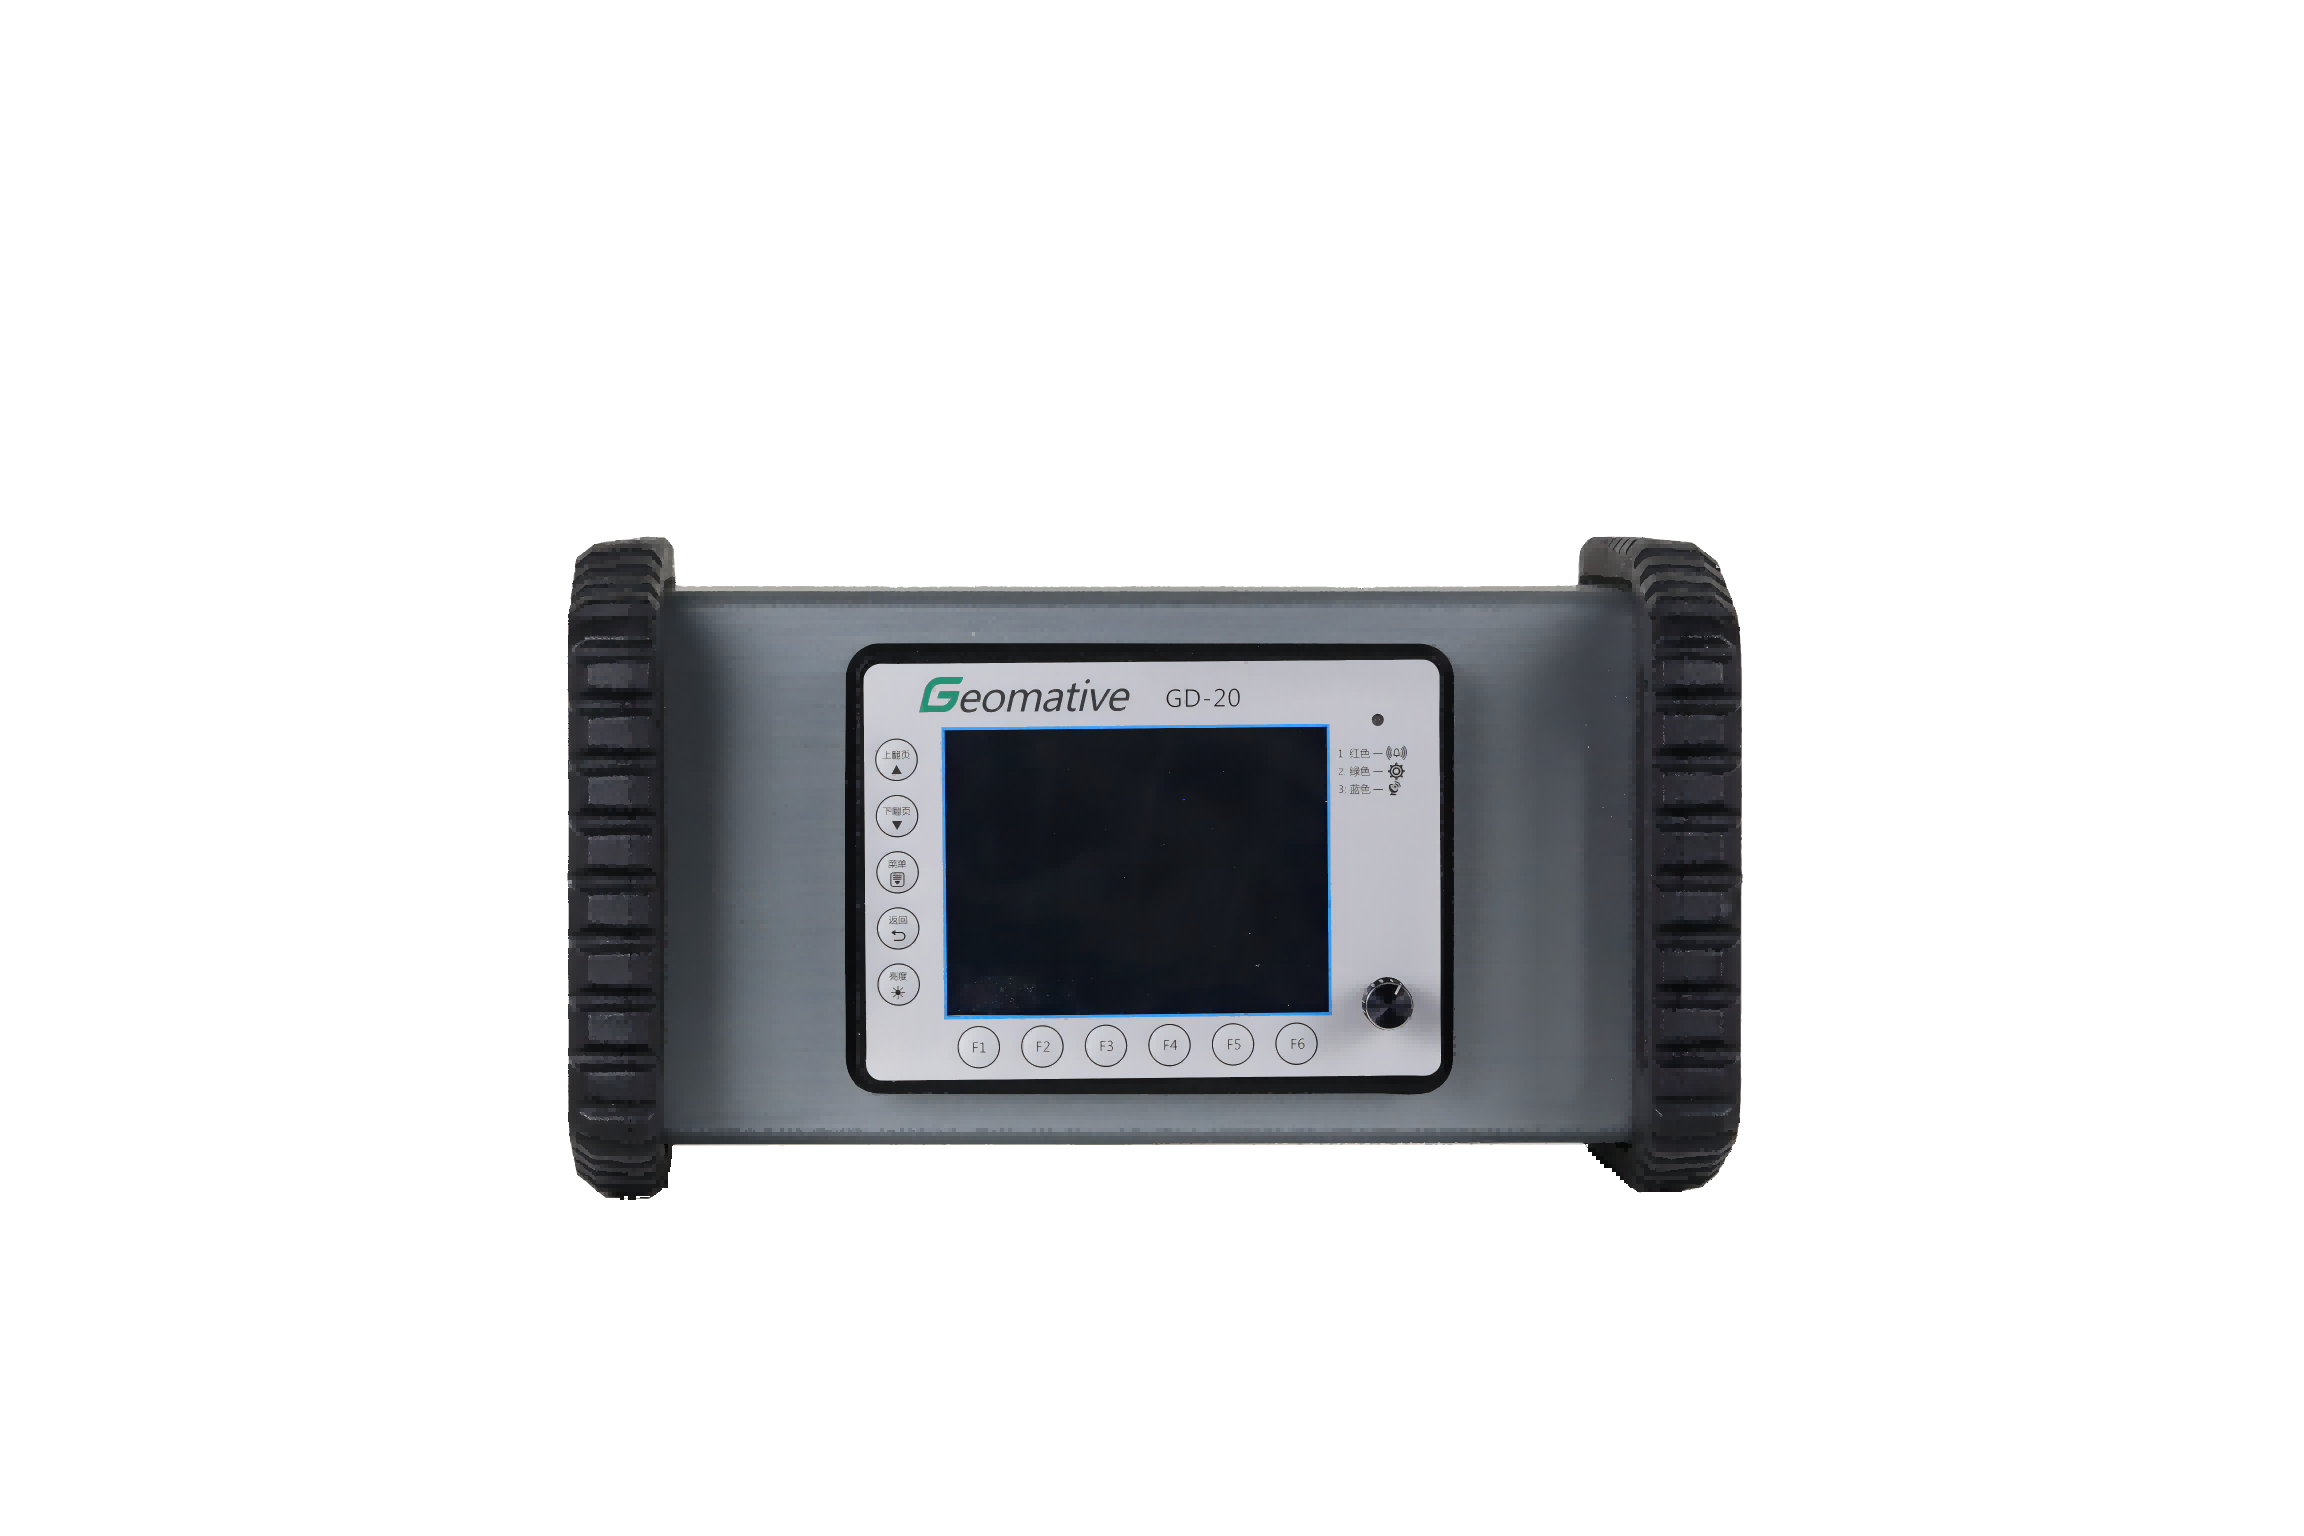

Industry-leading geophysical equipments and service provider supplier