2023-04-07 11:05:00source:
What is electrical resistivity?
Electrical resistivity sends an electrical current into the ground and maps the resistance against that flow of the current.The resistance can be converted to resistivity, a property used to predict the compositionstructure or strength ofthe underlying materials
As we all know. different geological materials present different resistivities. the presence of water or mineral ores typically lowers the resistivity of a material. and pollutants will also impact the recorded values.Typically.stronger and harder deposits will have a higher resistivity associated with them compared to rock with structural weaknesses
What are the common applications for electrical resistivity?
The applications for electrical resistivity are incuding but are not limited to Bedrock depth detection,bedrock topography,fracture and fault identification, cavity detection and mapping, ores and mineral deposits,geology, soil type or bedrock type/bedrock change,groundwater aquifers,groundwater contamination, saltwater intrusion, waste and pollutant mapping, etc
Resistivity is an excellent technique to use as a monitorina tool to record changes in ground conditions.Typically applications include groundwater monitoring around landfil areas, to see the spreading of leachate ormonitoring of water seepage through earth damsMeasurements can be made by returning to the same place several times to repeat measurements.or equipment can be left on site as part of an automated monitoring project
Electrical resistivity can be an efficient option tomap the subsurface conditions when you needanon-destructive investigation technique or want improved data coverage
compared to traditional point-by-point.intrusive methods(such as drllingor diagina)Measurements can be straihtforward soundinas(just measuring resistivity aqainst depth)
2D profiles or even 3D volumes.Data can be collected onland,in water,or within boreholes and can be single measurements or repeated readings to fulfll a need for monitoring
of changes in survey

What's the main method ofelectrical resistivity?
Depending upon the position of the current and potential electrodes,data will be collected at different depths(zco-ordinates) and beneath different surface positions(X and Y coordinates) as individual points.These can then be combined to create a 1D soundingor profile.a 2D profile or 3D volume
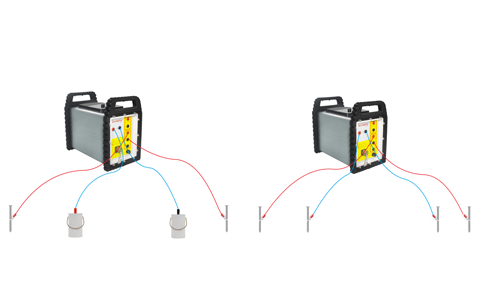
1D SOUNDING(VES) & PROFILING
A Vertical Flectrical SoundinoVES)measrementis where data are coected from dferent denths beneath a fixed pointat the suracethis means that all data points will have
the same surface position(X and Ycoordinates) but will be measured at different depths(Z coordinate)
Electrode placement is based around a midoointThe further way from the midpoints electrodes are placed. the deeper the measurement wll be.For each data point electrodes needs to be moved manually. Data are usually presented in a graph with denth on one axis and apparent resistivitv on the other These raw data are then put forward forn
inversion
Resistivity investiaation can also be carried out at a constant depth but under different surface positions.usually referred to as Profiling.These data is not normally put throuor
inversion,and a plot of resistance or apparent resistivity against profile distance is the final output.
2D AND 3D MEASUREMENTS(ERT)
By combining measurements at both different depth and lateral positions an ERT(Electrical Resistivity lomoraphy)survey also sometimes known as lmaging. is completed
Because ERT is a multi-dimensional methoddata points can be measured in a 2D profile or a 3D arid
For a 2D profile,multiple electrodes are placed in aline at a set distance.The system automatically selects which electrodes to use for current injection and voltage readings and. in a short time,can measure a high number of data points.Data points will have varying Xand Z coordinates,but a fixed Ycoordinate
For a large scale 3D survev. the data from a number of (ideallv parallel) 2D survey lines can be combined in the processina sofware to model resistivity variations in X.Y and 7
simultaneously.This process of forming a 3D dataset is specifically referred to a 2.5D survey
For smaller survey areas. electrodes can be laid out in a grid and the 3D dataset is formed directly on the instrument; this is a “true” 3D survey