
After the preliminary investigation, it was found that the local area is a homogeneous loess area, and the original resistivity shall be 100~200Ω·m. After an infiltration made before this resistivity experiment to ensure the measured actual resistivity was low, the average resistivity of background measurement is about 41Ω·m by the preliminary three-dimensional resistivity measurement
The resistivity difference between the high water content loess and the background loess is about 10Ω·m, and the change is small. The simple resistivity value is not easy to judge its permeation channel at present, and the percentage of the resistivity change before and after the water permeation experiment can be selected to judge its permeation process.
The principle of the cross-hole high-density electrical method is similar to that of the traditional high-density electrical method, the difference is that the cross-hole high-density electrical method performs discharge and data acquisition in an underground well. It can be seen from Figure 1 that the current line in the cross-hole form flows 360 degrees. Since the electrodes can be placed at the target depth, it is ensured that the cross-hole test method can provide better resolution in depth.

Fig.1 Schematic diagram of the electrode discharge field in the hole

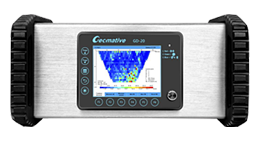
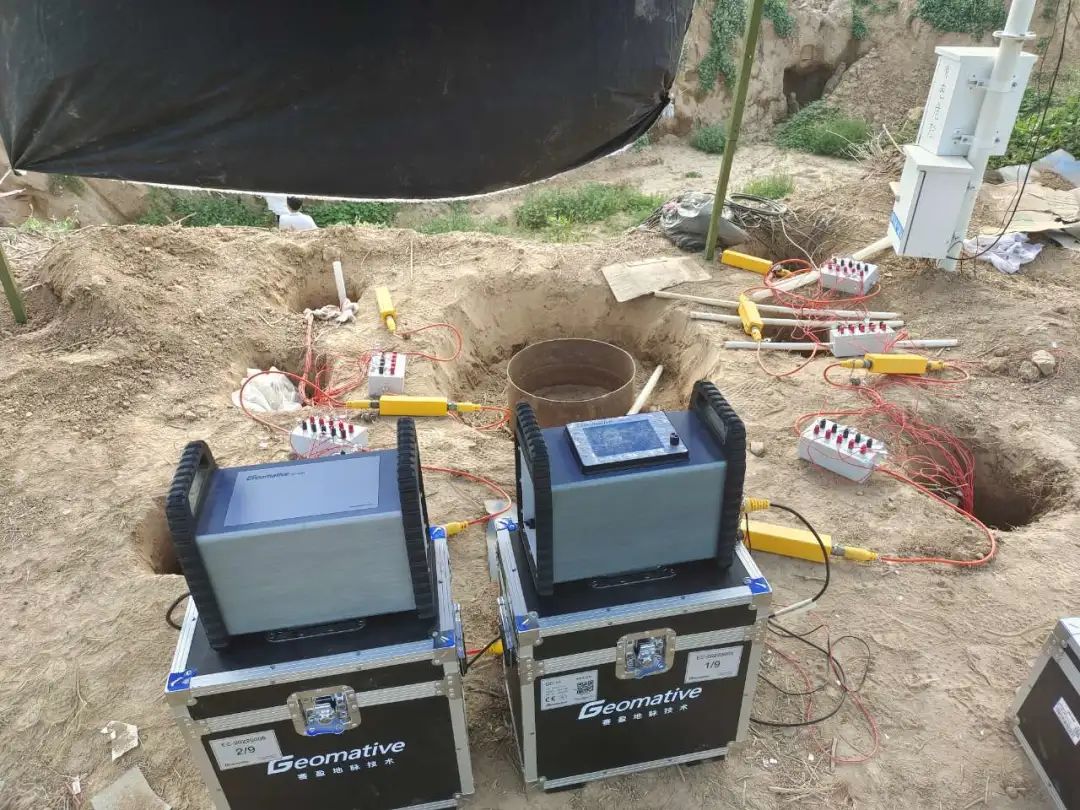
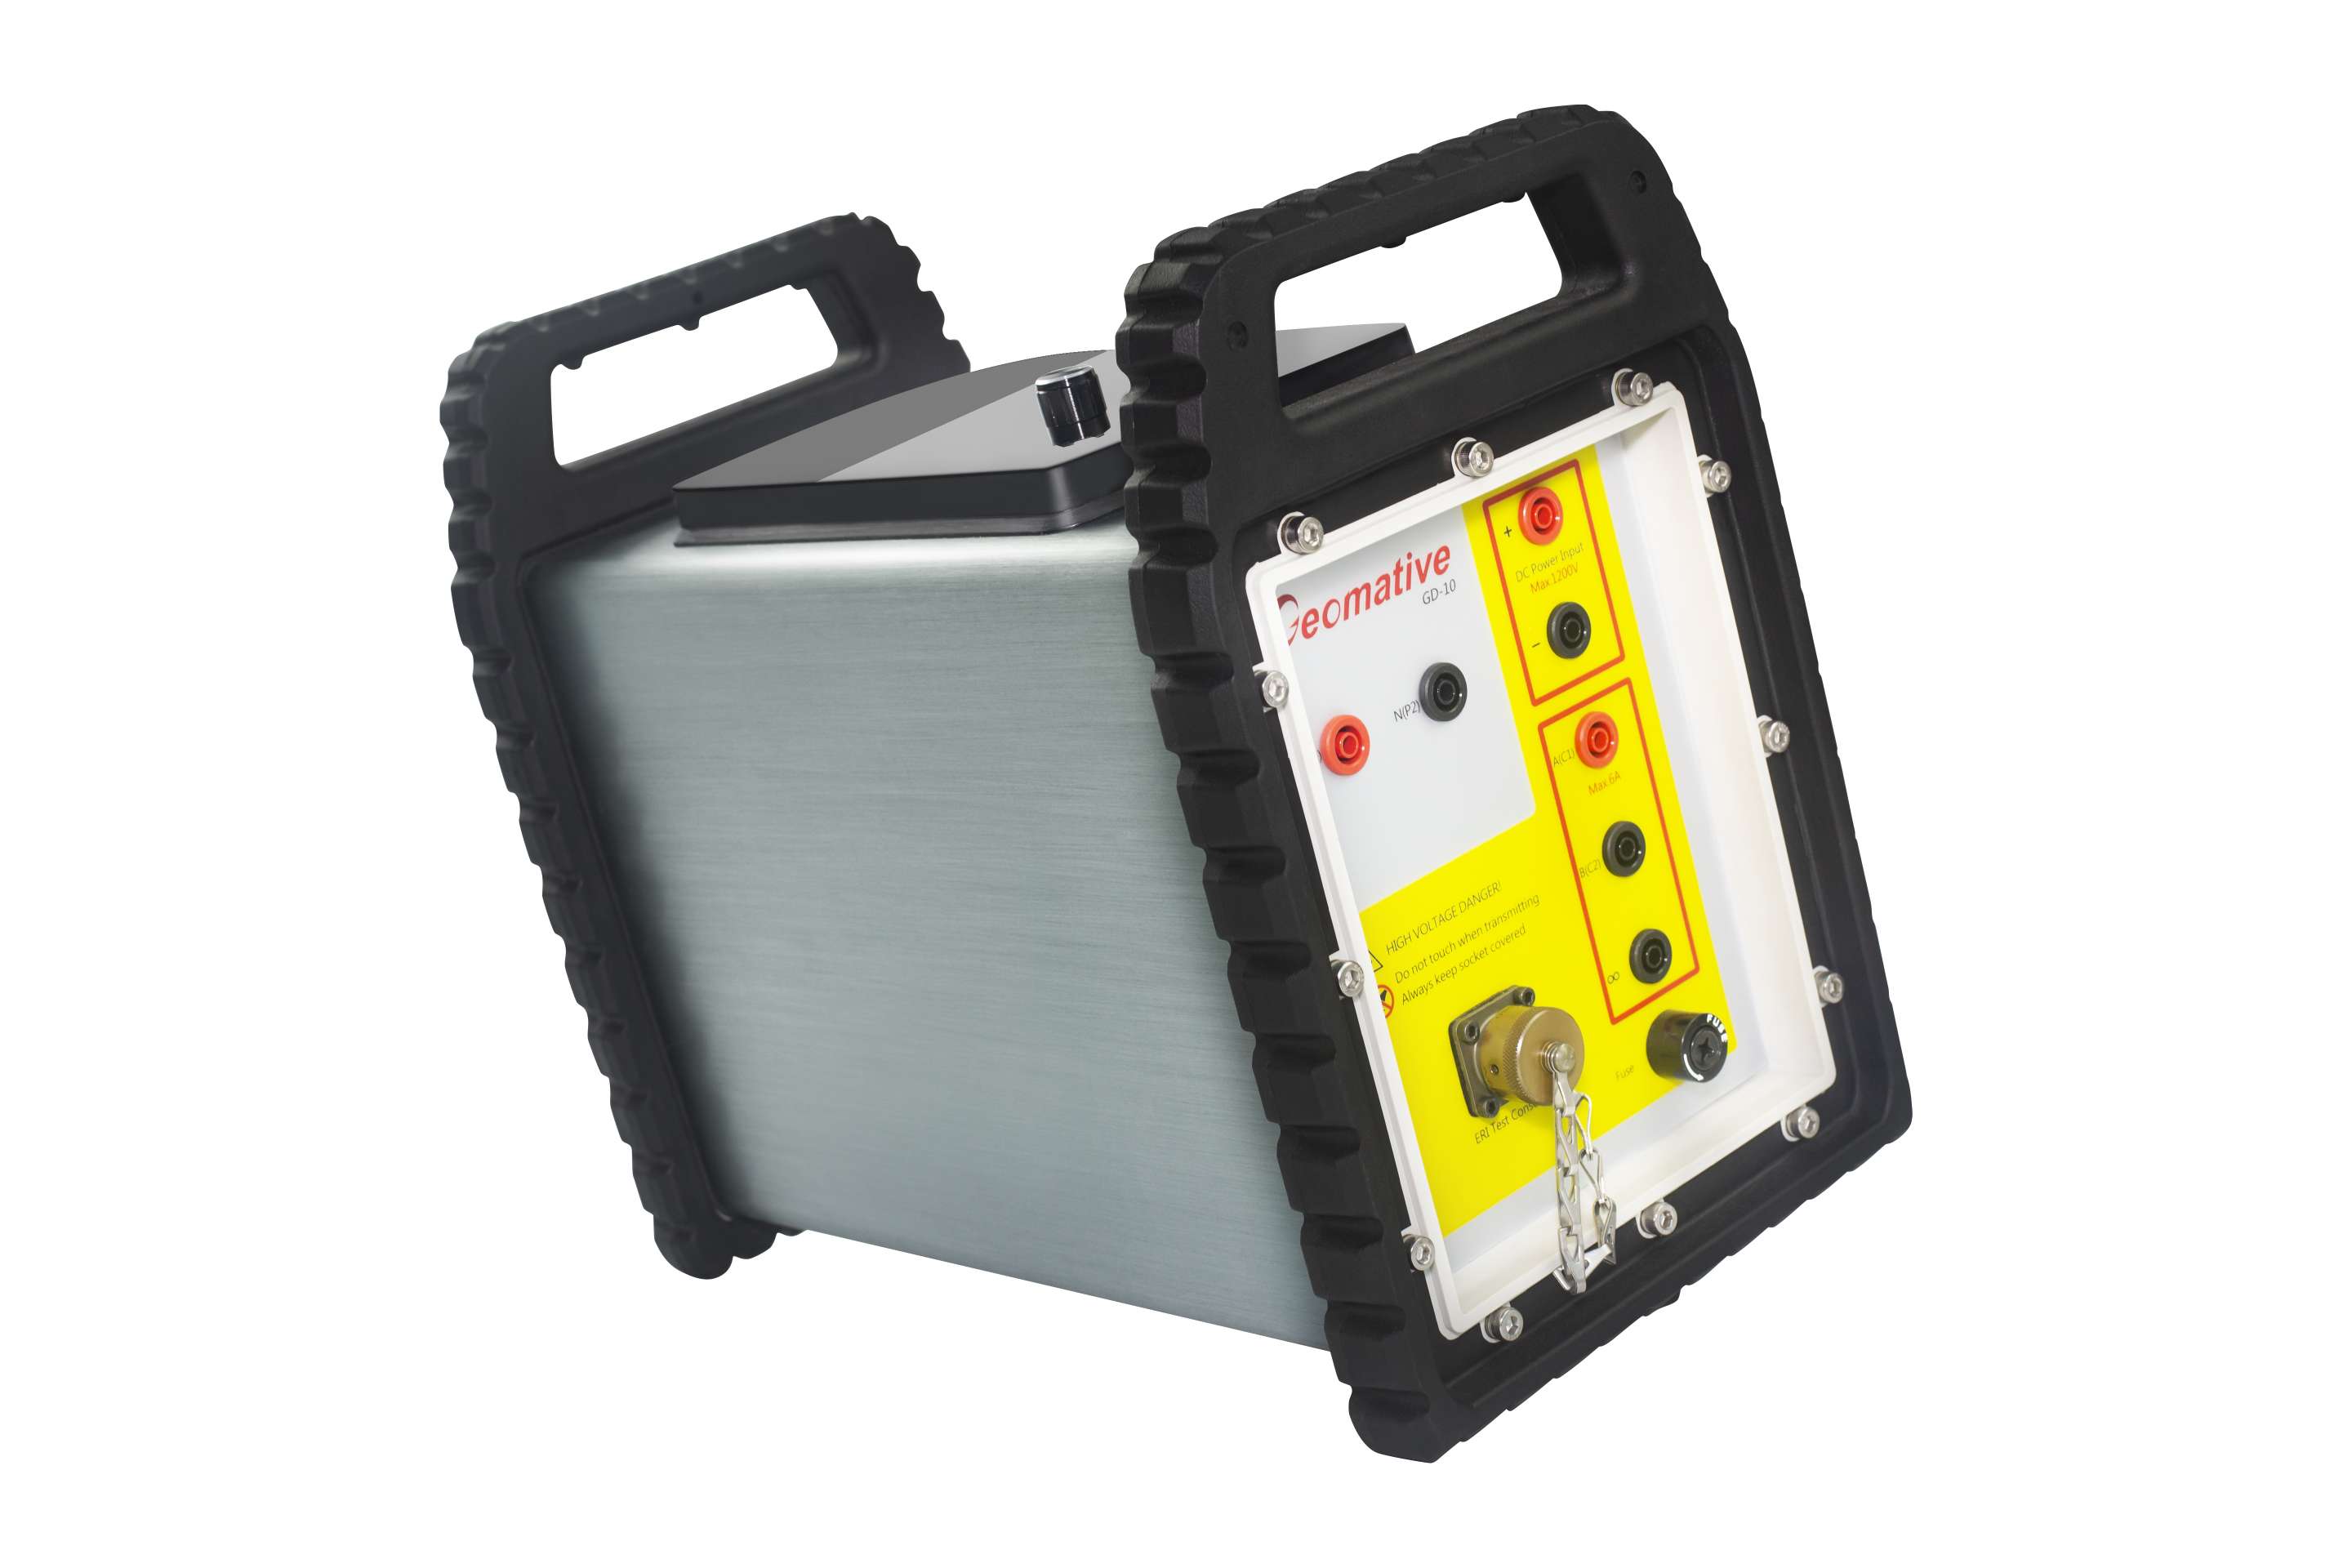
Figure 2 GD-10 high-density electrical equipment used in the experimental site
Figure 3 is a schematic diagram of the location of the monitoring wells set up in the experiment, each well has 15 electrodes, and the electrode spacing is 11 cm. Figure 4 is a schematic diagram of the three-dimensional cross-sectional electrode configuration, as shown below:

Figure 3 Plan of the monitoring configuration of the experimental plot

Figure 4 3D cross-hole configuration cross-sectional view
The process of water flow diffusion is depicted in terms of resistivity changes after irrigation. The resistivity surface is rendered top left, the resistivity volume is rendered top right, the resistivity volume below 30Ω·m is rendered bottom left, and the resistivity volume above 45Ω·m is rendered bottom right.


Figure 6 Abnormal resistivity change rate at different time periods
Conclusion:
The high density cross-hole can better describe the shape of water flow diffusion. In the drilling arrangement, the poured water will cause edge effect and cause anomalies around the electrode, so the electrode position is preferably outside our research scope. Similar experiments should be carried out in a relatively homogeneous field without disturbance as much as possible.

Industry-leading geophysical equipment and service provider supplier