
Background
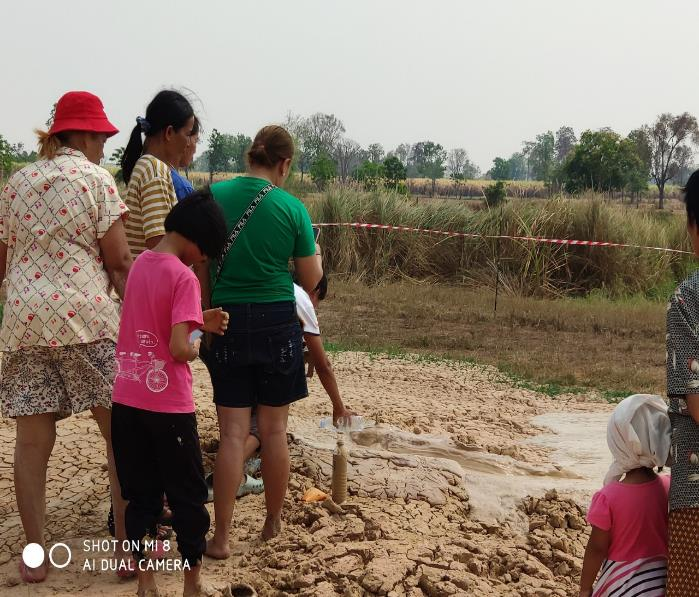
Soap hole phenomenon has occurred among of the paddy field at Nong Kung Noi village, Khok Krabueang Sub-district, Ban Lueam District Nakhon Ratchasima Provinece at February 2019. However, this pbhenomenon had happened at the same location a year before. Due to news reports on the event, many visitors were attracted to visit this place and some of them have behaviors that causes health risks such as drink water around soap hole location, masked body by taking mud of soap hole etc. furthermore, some people understand that this phenomenon may be supernaturally occurrence. However, quality of soil and surface water were official test. To support actual information in terms of subsurface geology and hydrology, 2D resistivity measurement were applied for illustrate subsurface geology feature at soap hole occurrence for manag
Objective
The aims of application of 2D resistivity measurement at soap hole phenomenon area to understand subsurface geological aspect and soap hole process
Research Instruments
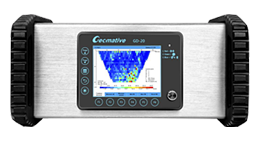
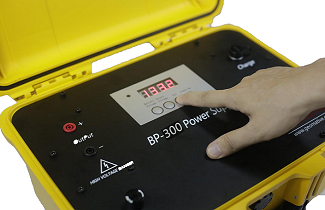
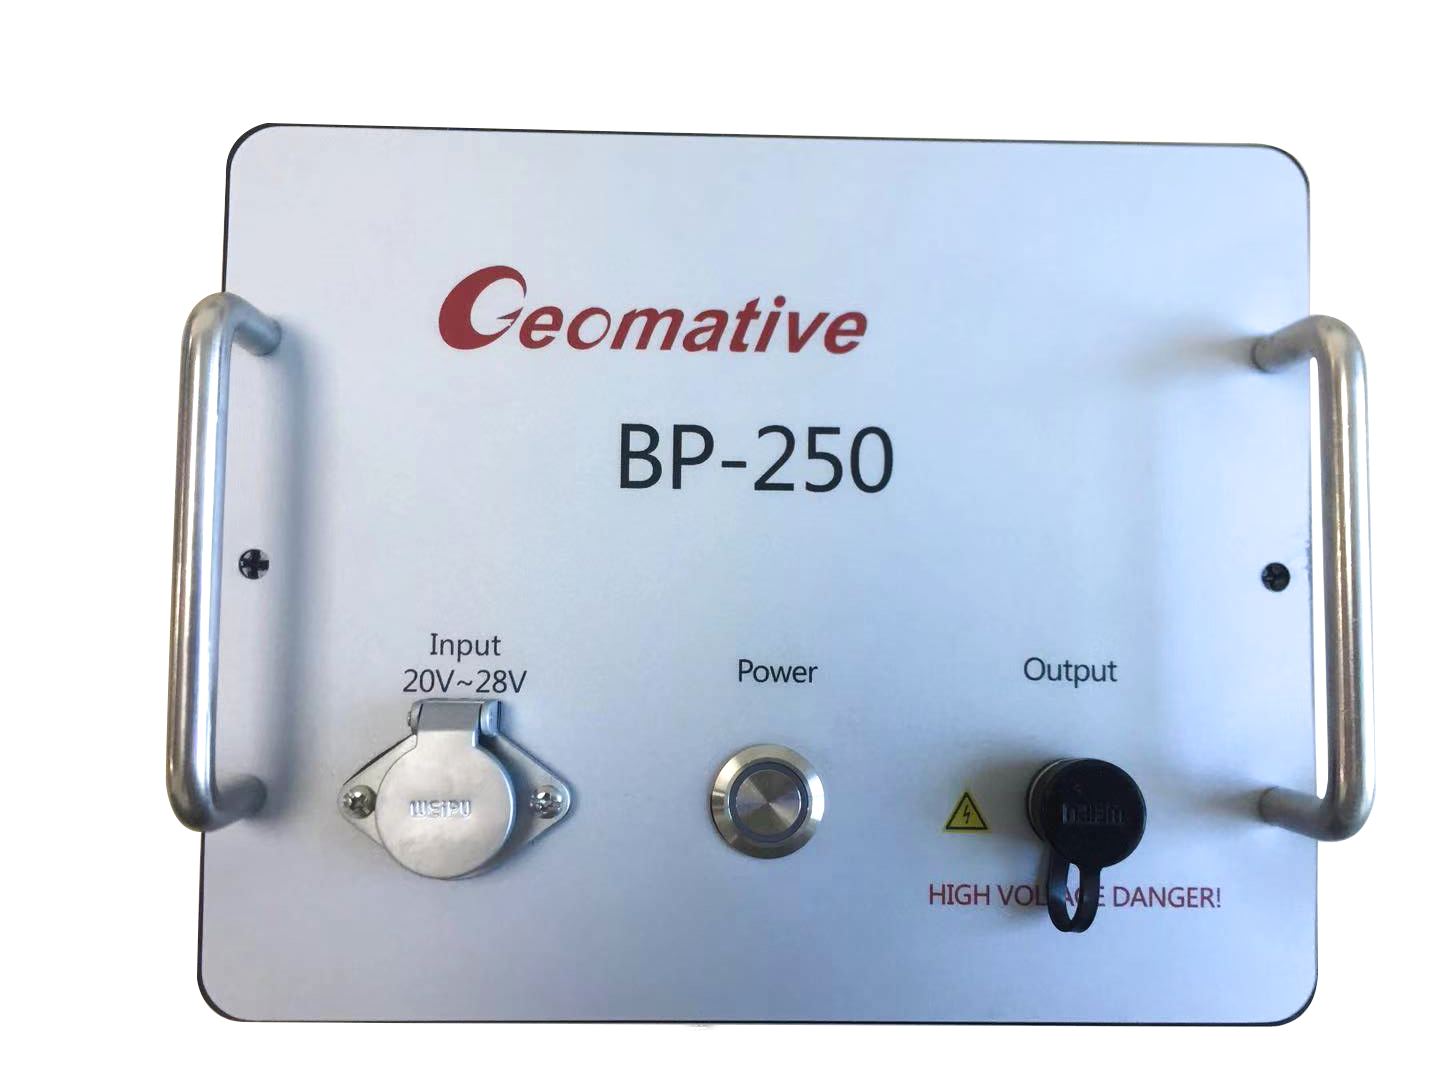
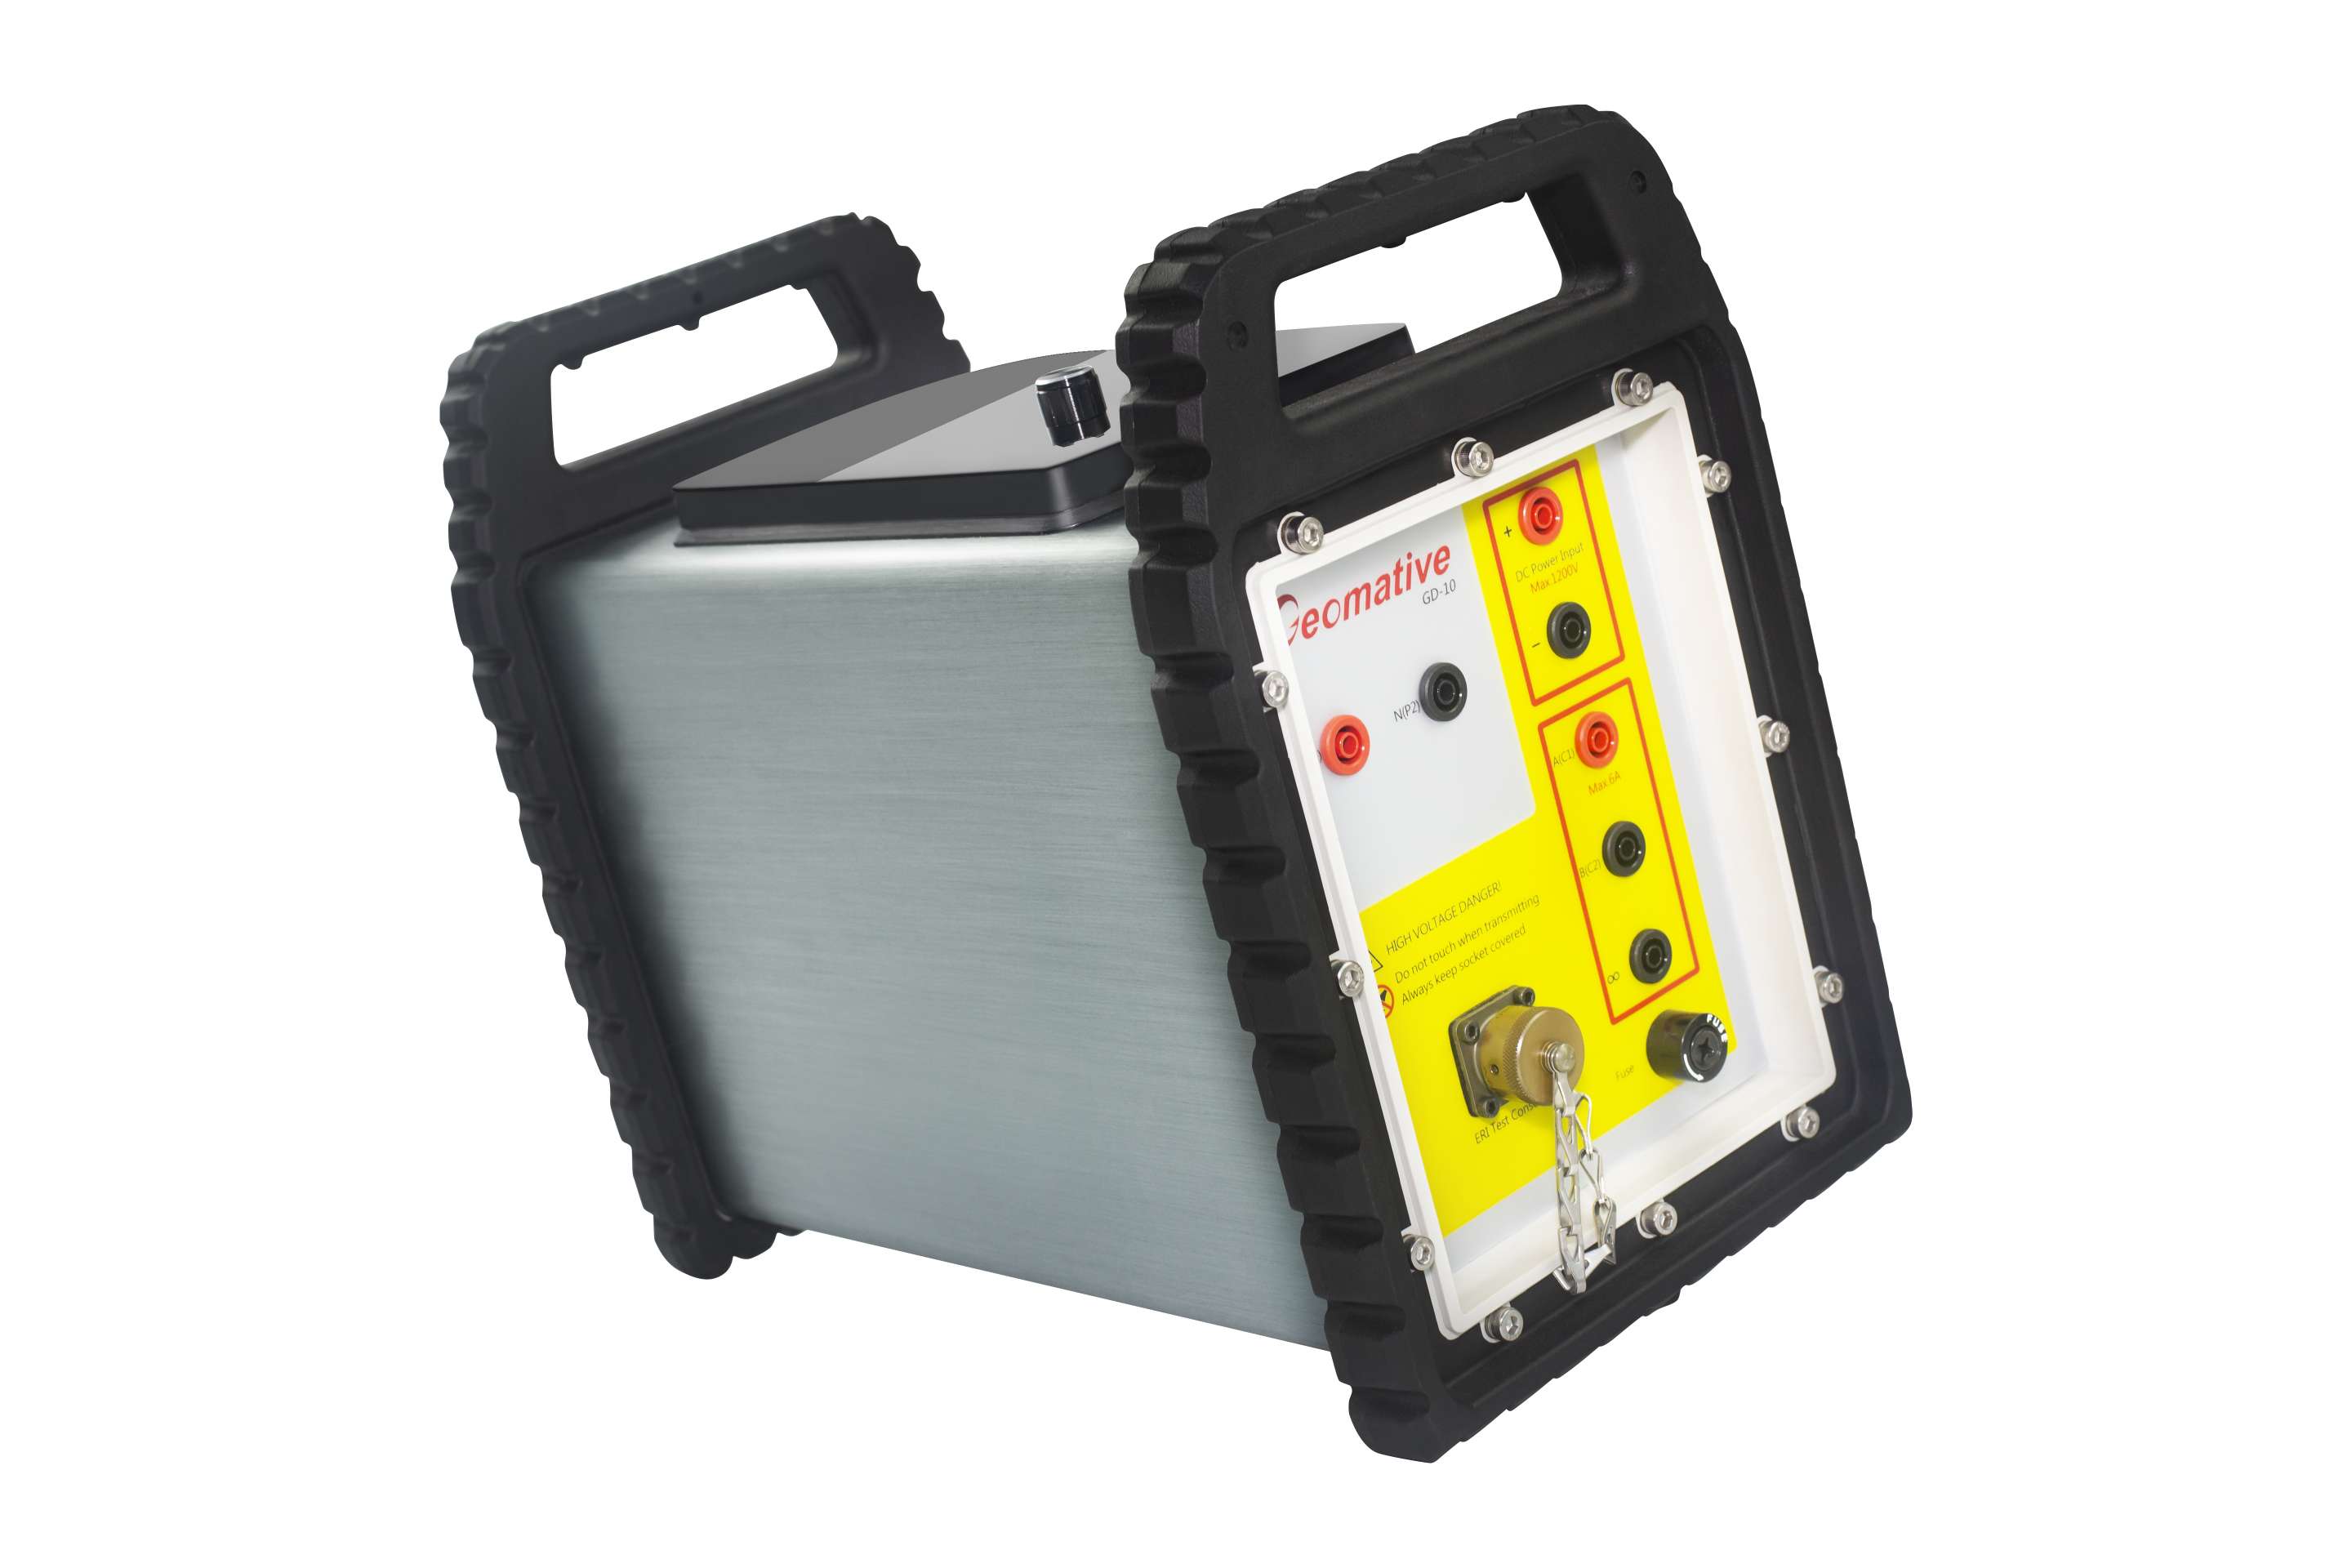
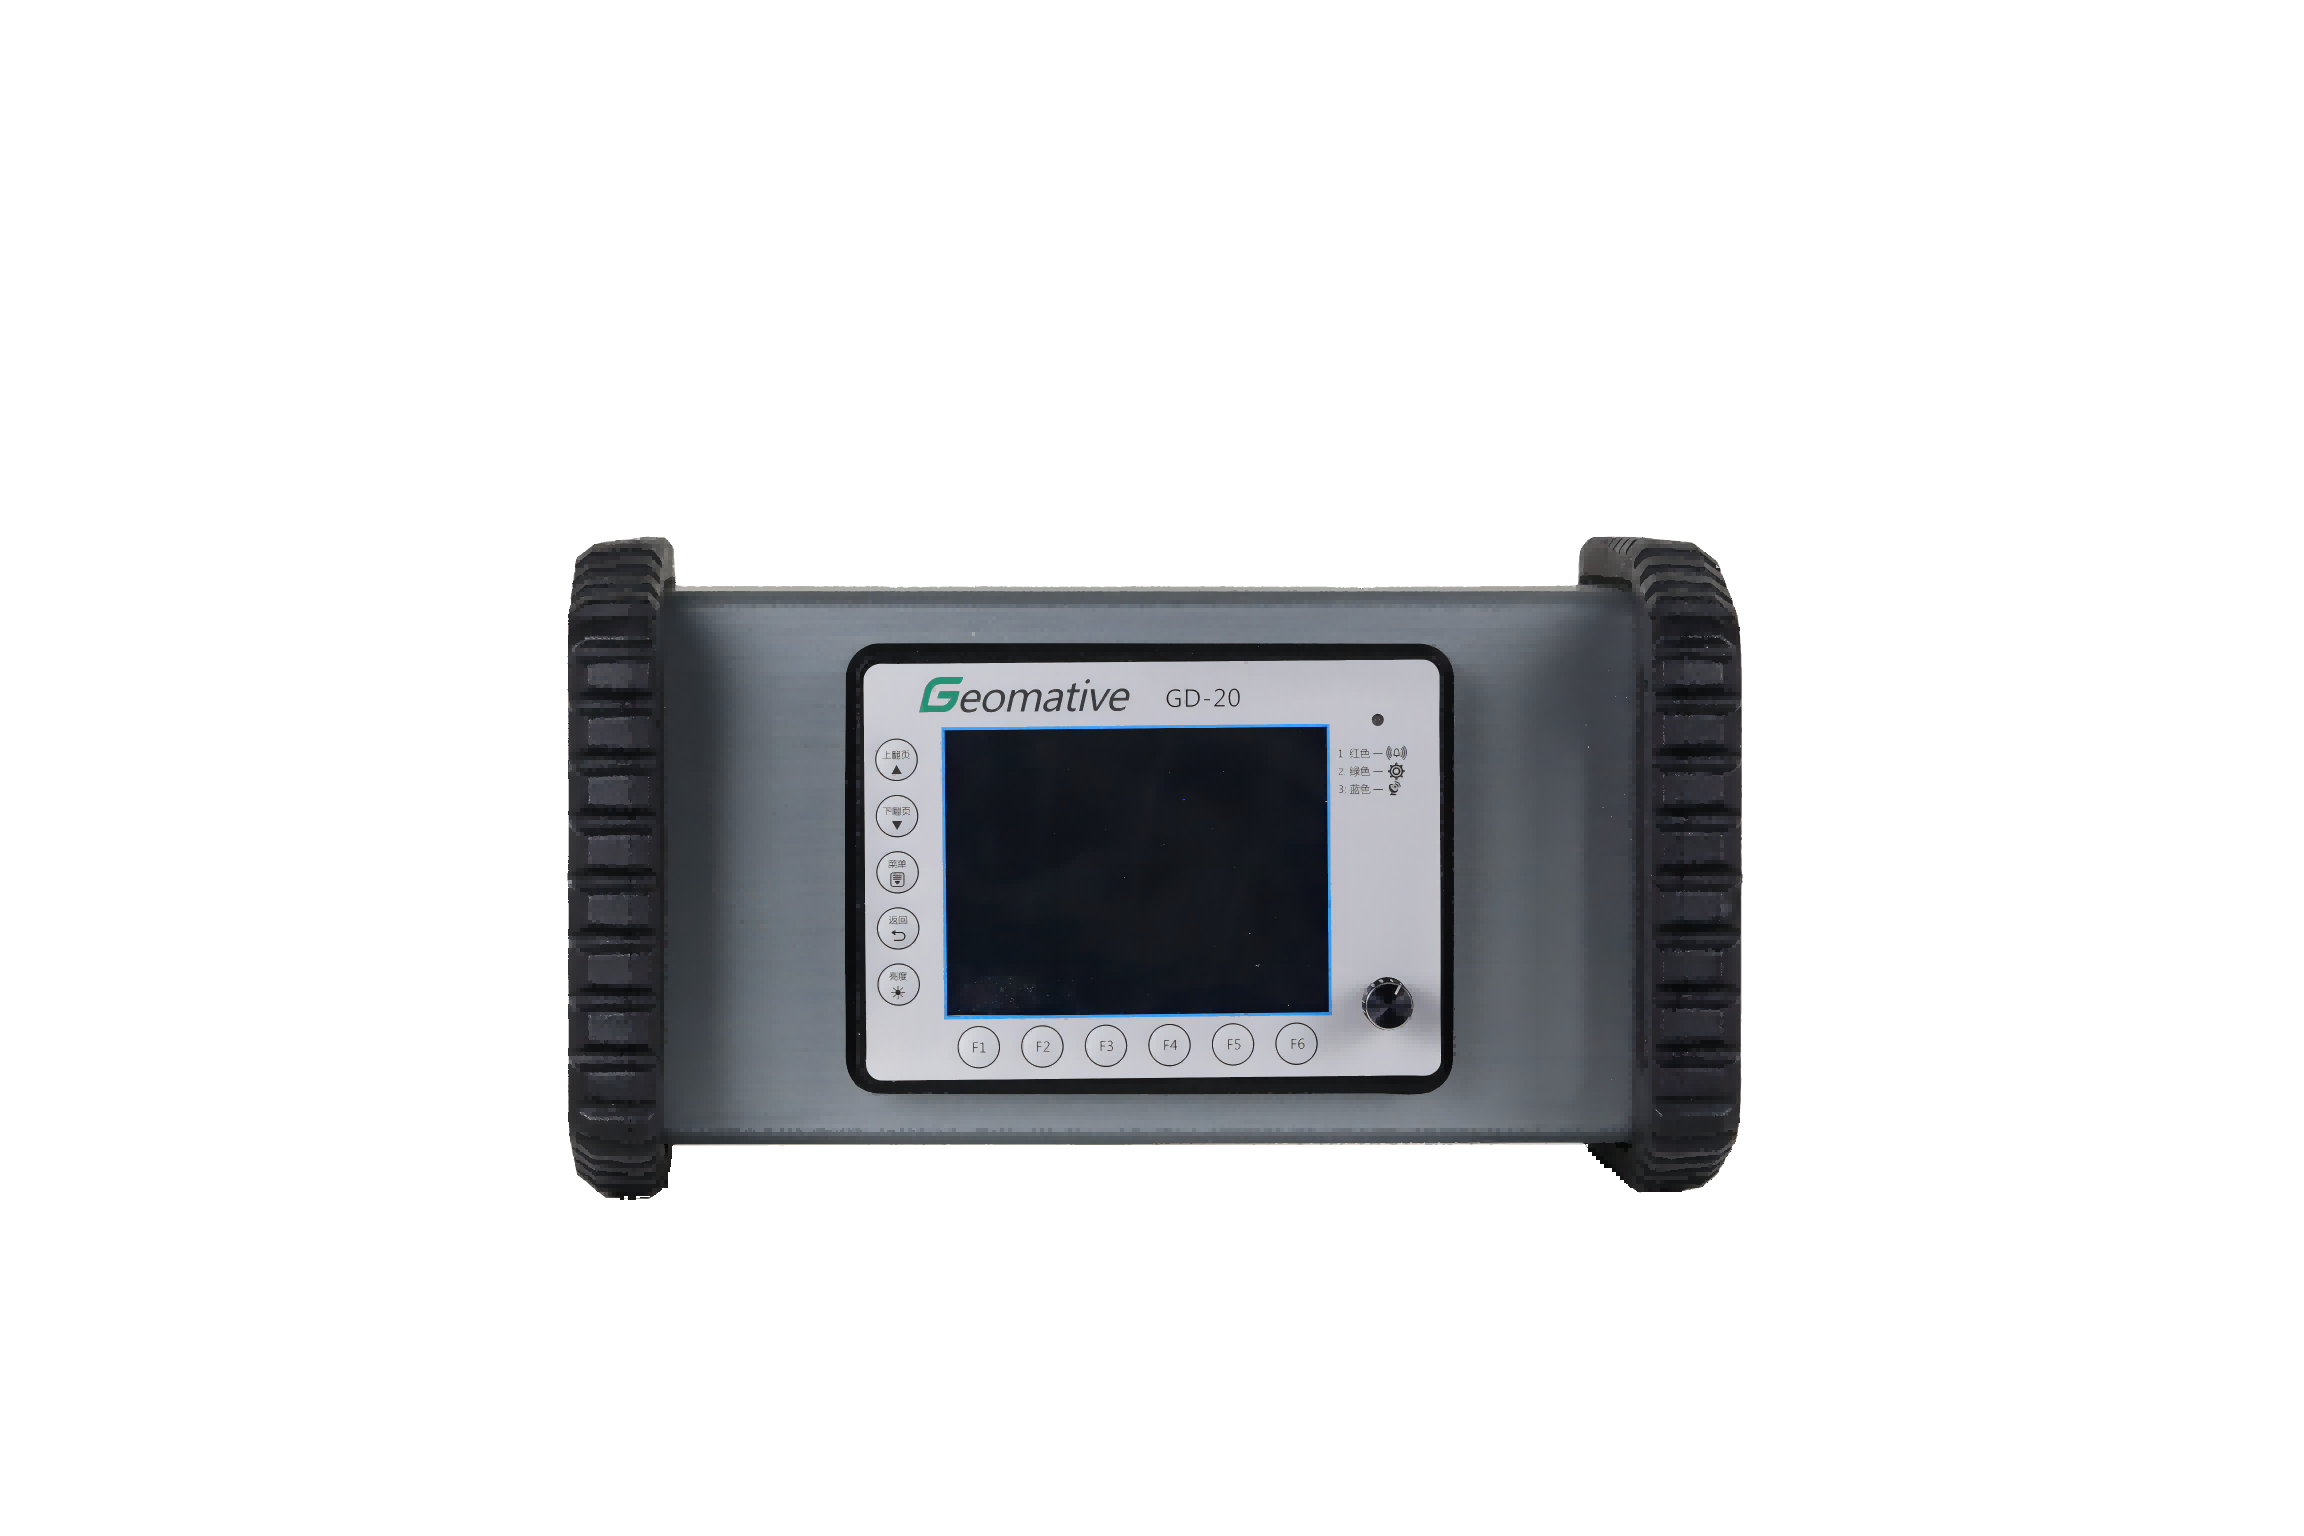
1. Resistivity meters and Accessories The instruments used for resistivity measurement to identify subsurface geology characteristic is Geomative GD20. This instrument can read multi-electrodes with high speed reading. The accessory item used for field instrument which consist of; Steel electrodes, crocodile clips, multi-channel cable and battery

Figure 1 Resistivity meters and accessories.
2. Software program
The software program was used to processing and interpretating resistivity data as follow:
2.1. Geomative Studio: for export data into .DAT file.
2.2. Ultra Edit for data management and prepare for input to inversion process software.
2.3. RES2DINVx64 by geotomosoft for 2D imaging inversion process.
2.4. Winsev Version6.3 for dataprossing and create 1D inversionmodel.
2.5. Oasis Montaj by geosoft for create resistivity map.
Location survey line
There are 4 surveys line with electrode spacing of 10 meter covering soap hole occurrence area. (3 lines in a North-South direction with a length of about 800- 1000 meters and 1 line in a East-West direction with a length of about 800 meters) The location of survey lines show in Figure 2


Figure 2 Location of survey lines.

Figure 3 Location of line A.

Figure 4 Location of line B.

Figure 5 Location of line C.

Figure 6 Location of line D.
Resistivity measuring
Resistivity measuring stage, 2D resistivity measuring was taken with multi-electrodes cable which 10 meter electrodes spacing. 2D resistivity survey were operated with schlumberger and Dipole-Dipole configuration. Dipole-Dipole configuration was designed for a shallow detail with about 50 meters depth while Schlumberger configuration was designed for a deeper part of subsurface and for VES processing with about 180 meters depth.

Figure 7 Line survey operated set up
Resistivity value data have been received from Schlumberger and Dipole-Dipole
configuration reading processed to created 2D section to descript the shallow detail. The data
from Schlumberger configuration reading is used for create 1D VES model for elaborate details
of resistivity and create resistivity map by Geosoft oasis montaj program.
The variation in resistivity values can be classified as Clay, Rock salt, Freshwater, and
Salinity water as following criteria
1. low resistivity (about 5-10 ohm.m) presented as clay layer. 2. slightly high resistivity (about 20-30 ohm.m) presented as fresh groundwater zone
3. very low resistivity (about 1-5 ohm.m) presented as salinity groundwater zone
4. very high resistivity (about over 100 ohm.m) presented as rock salt
Due to different technique processing, the result will be presented in 3 categories
1.2D inversion model
1.1 Line A (N-S Direction)
Very low resistivity zone (1-5 ohm.m) mainly found at the northern of line survey can be presented as salinity water of Maha Sarakham formation and found slightly high resistivity (20- 30 ohm.m) at depth 20-30 meter can be presented as fresh groundwater. The under layer of fresh water presented as clay layer (5-10 ohm.m). (Figure 4-1)

Figure 4-1 Resistivity as 2D section of Line A with Dipole-dipole Configuration, showing boundary of Maha Sarakam formation and Phu Tok formation, Fresh water zone and salinity zone.
1.2 Line B (N-S Direction)
Very low resistivity zone (1-5 ohm.m) mainly found at the northern of line survey can be presented as salinity water of Maha Sarakham formation and found slightly high resistivity (20- 30 ohm.m) at depth 20-30 meter can be presented as fresh groundwater. The under layer of fresh water presented as clay layer (5-10 ohm.m). In the deep part with depth 180 meters presented as rock salt layer. (Figure 4-2)

Figure 4-2 Resistivity as 2D section of Line B with Dipole-dipole Configuration, showing fracture in rock layer that significant relationship with soap hole occurred area.
1.3 Line C (N-S Direction)
Very low resistivity zone (1-5 ohm.m) mainly found at the northern of line survey can be presented as salinity water of Maha Sarakham formation and found slightly high resistivity (20- 30 ohm.m) at depth 20-30 meter can be presented as fresh groundwater. The under layer of fresh water presented as clay layer (5-10 ohm.m). (Figure 4-3) (Figure 4-5 for the deep part)
1.4 Line D (E-W Direction)
found slightly high resistivity (20-30 ohm.m) at depth 20-30 meter can be presented as fresh groundwater. The under layer of fresh water presented as clay layer (5-10 ohm.m). (Figure 4-4)

Figure 4-3 Resistivity as 2D section of Line C with Dipole-dipole Configuration, showing boundary of Maha Sarakam formation and Phu Tok formation, Fresh water zone and salinity zone.

Figure 4-4 Resistivity as 2D section of Line D with Dipole-dipole Configuration, showing fracture in rock layer that significant relationship with soap hole occurred area

Figure 4-5 Resistivity as 2D section of Line B with Wenner Configuration, showing Deep part of study area.
2. Integrate 2D Schlumberger and VES resistivity data
The result 1D inversion model at 4 station of line B (215m, 255m, 305m and 345m) are presented the layer of rock layer which separate in to 5 layers (as see in Figure 4-6)
1. Top soil layer can be estimate in depth about 2-3m.
2. Fresh groundwater of Phu Tok formation can be found at depth 10-20 m (about 30 ohm.m)
3. Clay layer can be found at depth 20-30 meters with thickness of 10 m (about 5-10 ohm.m)
4. High resistivity more than 100 ohm.m presented as anhydrite layer at depth 30-40 meters, this layer is indicated that rock formation was changed from Phu Tok formation to Maha Sarakham formation
3. Resistivity map
Resistivity map at depth 10m, 15m and 40m can interpret as follows;
1. Resistivity map at depth 10 meters (Figure 4-7), there are 2 zone of resistivity which interpreted as Phu Tok formation which resistivity about 20 ohm.m and very low resistivity of Maha Sarakham formation (<10 ohm.m)
2. Resistivity map at depth 15 meters (Figure 4-8), there are low resistivity in the soap hole phenomenon area expected as layer of Nava’s clay that causing soap hole occurrence.
3. Resistivity mapping at depth 40 meters (Figure 4-9), there are high resistivity (about 160 ohm.m) in the southern presented as anhydrite layer that dividing rock formation of Maha Sarakham formation and Phu Tok formation

Figure 4-6 1D model at line B with Schlumberger configuration.

Figure 4-7 Resistivity mapping at depth 10 m. Its show boundary of 2 rocks formations: Maha Sarakham formation and Phu Tok formation.

Figure 4-8 Resistivity mapping at depth 15m, showing Clay layer

Figure 4-9 Resistivity mapping at depth 40m, showing Anhydrite layer (pink zone).

Figure 4-11 Conceptual model of study area
Conclusion
The investigation of 2D resistivity with Dipole-Dipole (target depth of 50m) and Schlumberger (more depth of 160m) configuration which 80-100 electrode with spacing 10 meter are successful to illustrate subsurface geology aspect atsoap hole phenomenon area. The resistivity results cover area 1000 x 500 m The rock formation can be clearly classify as Maha Sarakham formations at northern part and Phu Tok formation at the southern part. The results of VES model can divide rock layer into 4 parts, first layer is slightly high resistivity presented as groundwater of Phu Tok formation at depth 20m. Second is slightly low resistivity (5-10 ohm.m) presented as Nava’s Clay layer at depth 30m, then high resistivity (>160 ohm.m) presented as anhydrite layer at depth 40m and the last is low resistivity (about 1-5 ohm.m) under anhydrite layer presented as salinity water of Maha Sara kham formation. Moreover, the research technique of resistivity can be applied for other area which soap hole occurrence was occurred.
Recommendation
1. The results of resistivity measurement can help to explain subsurface geology, however there should be study with more methods such as drilling bore hole (This method may be more understand soap hole occurrence)
2. The impact of soap hole occurrence is destroyed the agriculture area. The resistivity map can help to manage agriculture areas

Industry-leading geophysical equipment and service provider supplier