
Significant rise in demand of construction materials, it is important to carry out prospective research for the exploration of new resources and to estimate the reserves that are under construction. Igneous, metamorphic and sedimentary rocks are known to be as geological materials. Same as granites that is commonly used as aggregate source, dolerite is also an important part of the construction industry. It is being used as dimension stone, flooring tiles and paving materials. All over the world dolerite is famous for kitchen counter tops due to its high strength and attractive quality polishing. The granitic rocks with variation of color, mineralogy, textural characteristics and mechanical properties occur in different parts of Pakistan but very few are being mined for construction purpose. Mining of these deposits is very dependent on the accessibility. The purpose of this study is to undertake field visit to dimension stone (Dolerite Dykes, Market name “Black Granite”) deposit and quarry in Namal Khatha, Oghi, Mansehra, Higher Himalayas of north Pakistan, and to undertake assessment for technological up-gradation and model quarry development project for mechanized quarrying of dimension stone. The area is currently being mined by Indus Mining for the last decade, but there is no feasibility or reserve estimate report available. The area is located about 48 Km from Mansehra on Oghi-Darband Road. Mine is reachable through a jeep-able road from Namal Khatha. In past, various consultant geologists the study area but there is no detail geological assessment report available for this economic deposit. The main objectives of the present study are to review of the studies done by the local engineers and selection of the most significant areas for model quarry/up gradation and to estimate the remaining reserves of the dolerite (Black Granite). Two investigations methodologies were adopted in order to achieve the desirable projects objectives.

Key ObjectivesKey objectives of the present investigation were;
1. To map the joints and faults and integrate the dataset with geophysical data to provide direction and to estimate the remaining reserves of dolerite (Black Granite)
2. To suggest suitable location & direction for future mining in the studied area.
3.1 Reserve Estimate
In order to estimate the reserves of the dolerite the whole dolerite body was measured using the measuring tape. Reserve estimates were measured using the dimensions of the body, i.e., length, width and depth. Width of the dolerite body was variable and so average width was 18m. Vertical Depth of the body was also variable and an average estimated value 35m was taken. Specific gravity of the dolerite is taken as 3.2. By using the following equation total reserve estimates were calculated.
Total reserve estimate= length × width × depth × specific gravity
3.2 Recoverable Reserves
Worldwide an average expected recovery rate is 40-45% of the total estimates. By applying the same general rule to the dolerite deposit of the study area, recoverable reserve estimates could be calculated as follows;
Recoverable reserves= Total reserves×45/100
This is an arbitrary value and tonnage may vary as the dimensions within the deposit vary.
4. Geophysical Methodology
The geophysical mapping techniques especially “Electrical Resistivity Tomography” has advantage to acquire data in the form of 1 Dimensional, 2 dimensional and three dimensional. Intrusive rocks, response to electrical current is very remarkable signature and provides relatively high electrical resistivity values as compared to the surrounding host rocks. Therefore, this makes electrical resistivity tomography excellent technique in intrusive mapping and good choice for hard rock quarries. Additionally, it is also one off the challenging task to provide probable location and direction of mining trends in the study area. Investors are usual frustrated when trial pits fail and may think that their investments are wasted. In this project, electrical resistivity tomography profiling, topographic and surface geological map data were acquired and integrated to get meaningful results to educate the client for probable location and direction of mining activities in the studied area. The electrical resistivity method is used in the study of horizontal and vertical discontinuities and uses the electrical properties of the ground. It utilizes direct currents or low frequency alternating currents to investigate the electrical properties (resistivity) of the subsurface. Resistivity contrast between the target rock and the background geology must exist. Igneous rocks show the highest resistivity responses with surrounding geology. Sedimentary rocks are the most conductive due to their high fluid content and metamorphic rocks have intermediate but overlapping resistivity responses. The age of the rock is also an important factor of resistivity as young volcanic rock (Quaternary Rocks) shows lower resistivity compared with old volcanic rock (Precambrian Rocks). Electrical resistivity is commonly applied to: groundwater exploration, mineral exploration, detection of cavities, exploration of waste and engineering sites, and Oil exploration. The location map of the studied area is shown in the Figure 1.
4.1 Resistivity Imaging Equipment
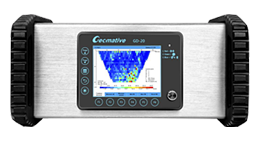
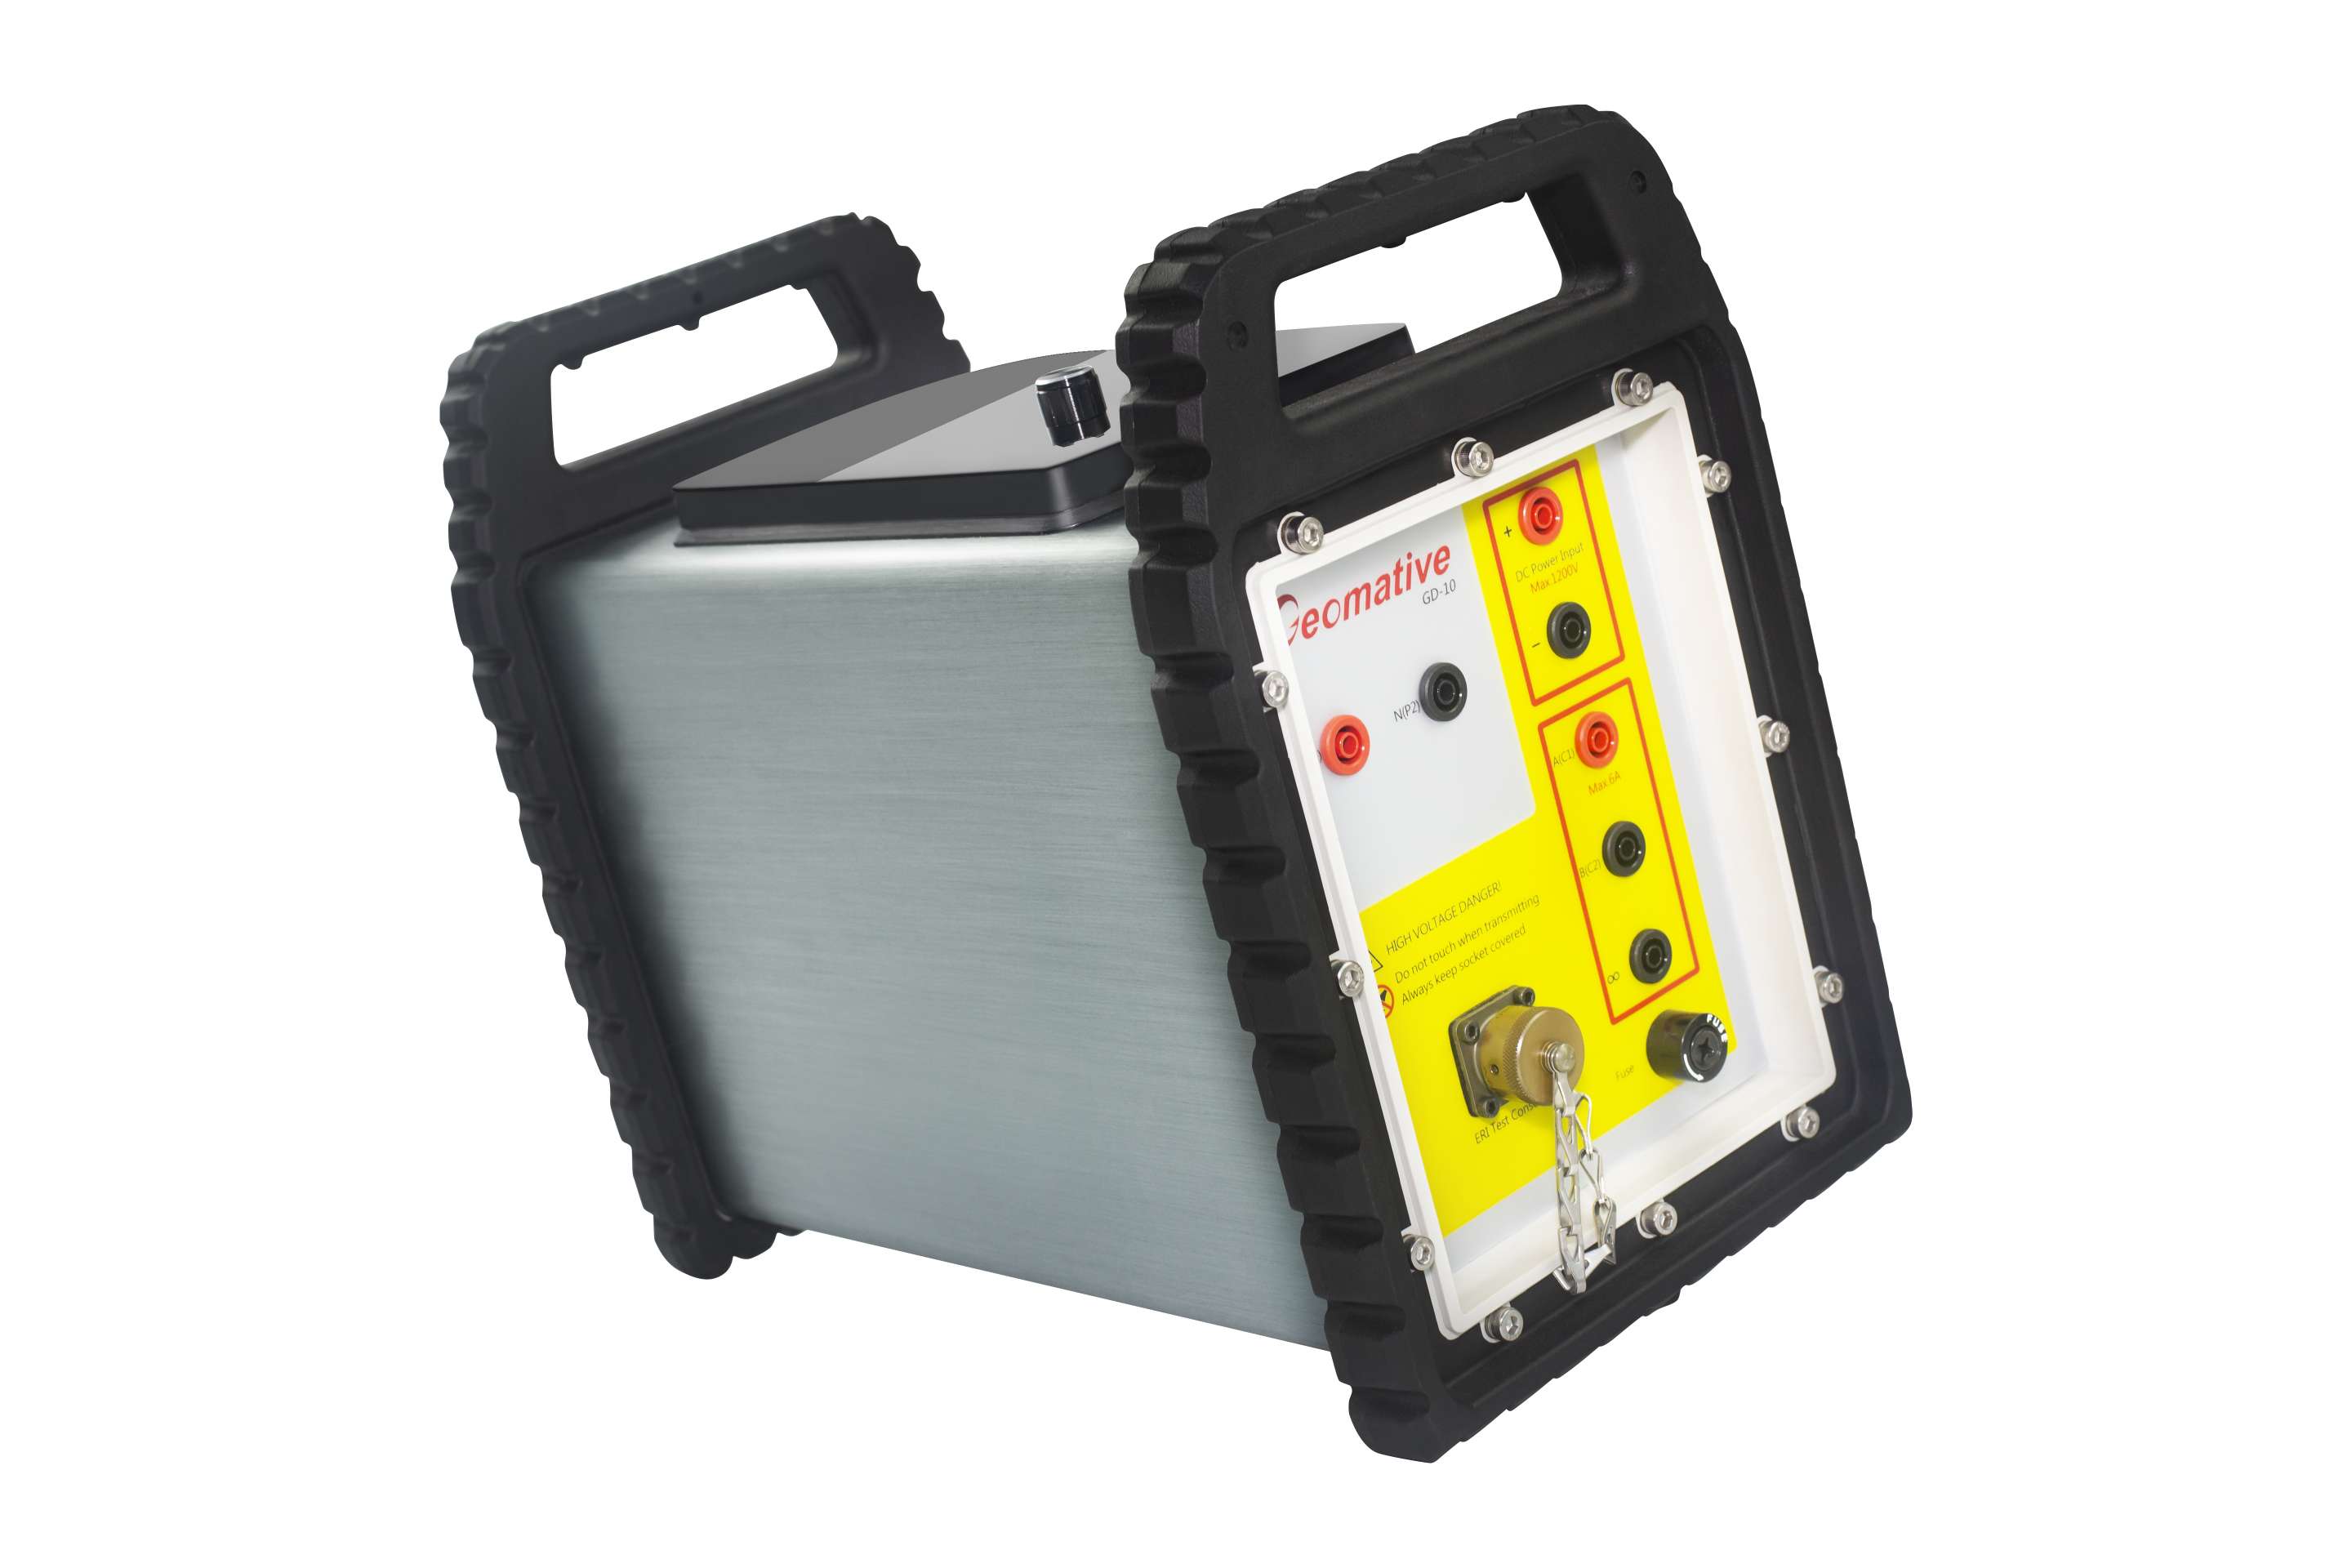
The apparent resistivity data is recorded by using low frequency alternating and direct current. The Geomative GD-10 (Resistivity Meter /IP) was utilized to acquire electrical resistivity data in the research area. This equipment is commonly used for groundwater exploration, environmental and engineeringews and geological investigations etc. it is light in weight, convenient in operation, having transmitter and receiver are combined in the same case. It can perform both resistivity and induced polarization measurement simultaneously, this equipment can be used to acquire multi electrode resistivity measurement. The nine configurations of electrodes are displayed by large LCD. Other main accessories of the equipment are 300 m long multi electrode intelligent cable with 5 m takeout spacing, four rechargeable batteries, 60 stainless steel electrodes, hammers and measuring tapes. However, in this research only 60 electrodes with 1, 2 and 3 m electrode spacing were used (due to topographic constraints) to image the internal structure of the landslide. The Geomative GD-10 resistivity / IP meter is designed for optimum versatility in infrastructure projects and environmental studies. Additionally, the tool has built-in quality control and feedback to operator. It can acquire 1D, 2D and 3D and 4D geo electrical resistivity surveys.
4.2 Electrical Resistivity Tomography Field Data Acquisition and Processing
In the current research project, Geomative GD-10 (Resistivity / IP) meter has been used for acquiring ERT data set by implementing various electrodes configurations (such as Dipole-dipole, Wenner and Schlumberger, in order to get detailed scanning of the subsurface anomalous zones and geological structures. This kind of approaches have provided fruitful information for interpreter and helpful in understanding the near surface phenomenon. Furthermore, ERT profiles using 1, 2 and 3 m electrode spacing in order to obtain a reasonable resolution, reliable subsurface coverage and the understand the sensitivity / importance of the ERT survey for the project area. The datasets were acquired with four different electrodes configurations, however dipole-dipole electrode configuration data has been processed to image the subsurface strata as this configuration acquires huge amount of data set and provide high resolution subsurface image as compared to other configurations. As the area lies in the variable surface topographic region; therefore, topographic inversion using finite element and finite differential methodology has been adopted, in order to get the realistic subsurface images at the studied area.

Geological Data Acquisition for Suitable Location & Mining Direction
Most important consideration in the mining of dimensional stones is the size of the block. Size of the block is dependent upon the pattern and spacing of joints and fractures with the rock. Most suitable location for the mining of dolerite as dimensional stone could be determined by studying the attitude of the joints and fractures and measuring the spacing between the joints and fractures.
For this purpose, the whole dolerite body was investigated to find the dominant systematic and non-systematic joints and fractures and discontinuities. Fracture and joint analysis were carried out from starting point till the end of the exposed dolerite body. Variations in joint attitude and spacing were also investigated from base to top of the dolerite body.
The surface geological and geophysical techniques were combined in order to map the intrusive bodies for development of commercial quarry. The dolerite was estimated using electrical resistivity, depth, width, length and specific gravity value. The target rock was distinguished from other associated rocks using resistivity variation. It is suggested to start development in the green zone for successful project outcome.

ERT Profile 01
Electrical resistivity variation show low and high zones are present in the inverted ERT images and manifest the fissured zone geometry and its orientation. In electrical resistivity investigations, the instrument measure the potential difference of voltage injected into heterogenous and anisotropic subsurface, the apparent resistivity data need to be inverted to true formation resistivity in order to reconstruct the subsurface resistivity of the underlaying strata. It is essential to apply proper inversion technique and aid to generate ERT imaging profiles for interpreting the subsurface. The subsurface concur the abrupt drops in electrical resistivity indicate the highly fractured zone (high water content) or probably higher clay/water contact or mineralogical composition. These zones are usually related to the internal structure of subsurface strata. ERT Profile 1 was acquired in as shown (Fig2). Inverted section ERT Profile 1 indicates different layering and contrasts in electrical resistivity along the acquired section. A semi-continuous very resistive layer is located near the surface having variable thickness and ranging in resistivity between (3000 to 10000 Ωm), which depicts the partly fissured zone of the parent rock (Dolerite). The first 14 meter horizontal distance approximately along the profile up to the depth of 8 meter can provide good yield. Contrary, lower resistive layer appears beneath the toward end of the profile is high fissured zone, from top of bottom 2 meters with resistivity ranging from (15-560 Ωm). The high-water content in the fractured in dolerite and gouge material creates the higher conductive / low resistive values. Additionally, this zone is continuously propagating down the depth

Figure 2 illustrate the various fissured zone based on electrical resistivity contrast values
6.2 ERT Profile 02
Inverted section ERT Profile 02 indicates different layering and contrasts in electrical resistivity along the acquired section. The first 48 meter is in the contact point of dolerite & the host rock, the (48-78-meter) horizontal distance highly fractured zone is located up to the depth of 18-20 meter. 78-96 meters partly fissured zone is located and can provide good quality of dimension stone in the studied area. From 96-174 meters, the first 18-22 meter is highly fractured zone, however, the deep zone below (22 meter) indicated moderate fissured zone.

Figure 3 shows the resistivity variation of surface soil, contact points and dolerite fissured zone
6.3 ERT Profile 03
Inverted section ERT Profile 03 indicates different layering and contrasts in electrical resistivity along the acquired section. The first 48 meter is in the contact point of dolerite & the host rock, the (48-58-meter) horizontal distance highly fractured zone is located up to the depth of surface to 12-meter depth. 58-174 meters horizontal distance indicates highly fissured zone and the its extended up to the depth of 12-18 meter. Which cannot provide good quality of dimension stone in the studied area. However, the deep portion below (12-18 meter) are moderate fissured zone, and its extended up to the depth of 36-meter depth.

6.4 ERT Profile 04
Inverted section ERT Profile 04 indicates different layering and contrasts in electrical resistivity along the acquired section. The near surface is comprised of Saprolite, however, can spot good quality between 40-64 meters horizontal distance. The 8-12 meters depth zone along the profile is comprised of highly fractured zone. The lower portion from 32-96-meter horizontal distance at depth below 12 meters provide moderate fissured zone and can provide better yield. Additionally, this zone is extended up to the depth of 24 meter.
58-174 meters horizontal distance indicates highly fissured zone and the it is extended up to the depth of 12-18 meter. Which cannot provide good quality of dimension stone in the studied area. However, the deep portion below (12-18 meter) are moderate fissured zone, and its extended up to the depth of 36 meters depth.

Figure 5 shows the scapolite, moderate & highly fissured dolerite zone
7. Zonation based on Surface Geological and Geophysical Analysis
Surface geological and geophysical investigations were integrated to identify the production zone for near future. Figure 6 is divided into three distinct zones (Red, Orange and Blue). The red line indicates the surface contact boundaries, and the blue lines indicate the orientation of ERT profiles, and digits shows the horizontal distance on profiles & the coordinate are incorporated in the Google Earth Pro.

Figure 6 depicts the probable zones based on geological and geophysical analysis

Industry-leading geophysical equipments and service provider supplier