
Shallow cavities found at the quarry of limestone mine of Siam City Cement Public Company Limited, at Kaeng-Khoi district, Saraburi province, may cause an accidence with heavy vehicle works due to sinkhole collapse.
The application of 2D resistivity imaging with contact electrode was previously successful to determined shallow cavity in limestone mine. Then a new technique with ERT resistivity equipment, 3D resistivity measurement with S-Shape electrode configuration was attempted to locate shallow cavities within limestone layer which may display in more detail feature than previous 2D resistivity imaging result.
ERT resistivity methodis successful in developing data collection as 3D s -shape resistivity system that can show mapping shallow cavity in detail scale for the purpose of future safety management and prevent possible occur an accident in mining activity.
Objectives
The application of 3D S-Shape resistivity measurement is to figure in detail scale the shallow cavity at face limestone mine that may help to manage mining activity in safe from sinkhole accidence by heavy vehicle working.
Location of survey area
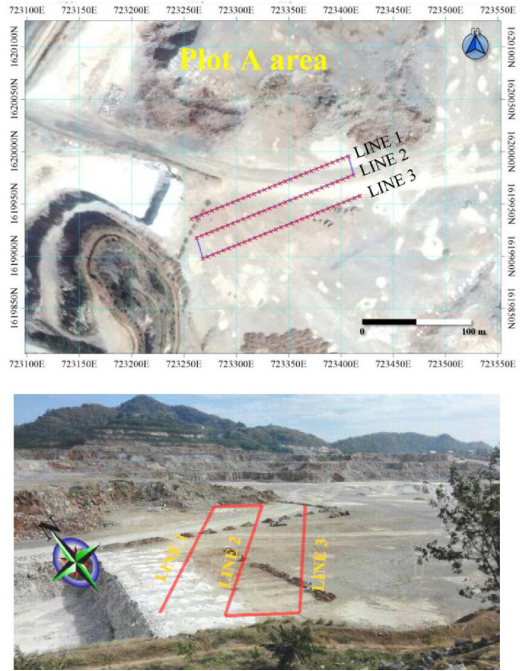
The survey area is located at limestone mine face of Siam City Cement Public Company Limited. The position of the mine displays faraway from Saraburi city around 20 km to the East where found in the topographic map sheet no. 5238 III (Amphoe Muak Lak) SERIES L7018. The boundary of the study area (Plot A and Plot B) covers of 722000E to 722350E, and 1619500N to 1625000N (Figure 1).
Topography of survey area
Both survey sides, Plot A and Plot B, are located in limestone mine with the elevation of the survey area is around 220-250 m (above mean sea level). Landscape of ground surface at the surveying displays as flat area by filled the basement with crushed stone. (Figure 2)
Electrode configuration of 3D S-shape is linked for all survey lines (involving in taking measurement) to become in one connection system by connecting the end electrode to the next electrode of alongside survey line (as shown in Figure 9). Resistivity values having to collect in a complete 3D resistivity data set, should be performed in all possible direction
Resistivity value data obtained from 3D-S-Shape technique, could be presented as 2D section and 3D cube picture. As reading system, both data from Dipole-Dipole and Schlumberger array to create the 3D model to locate shallow cavity boundary.
As conceptual interpretation, cavity and limestone regions can be classified due to the different in resistivity value as follows;
1)Shallow empty (air) cavity zone identified by Very high resistivity value (>5000 Ω•m)
2)Surround country rock (Limestone) with different texture and dense of rock layer indicated by Vary resistivity value (generally 100-2000 Ω•m)
Compare the result showing Cavity zone (very high resistivity – red color) found in 2D resistivity section where data obtain from Dipole-Dipole and Schlumberger electrode array reading in Figure 15 and 16 for Plot A area. and Figure 25 and 26 for Plot B Area, respectively.
With data processing, 3D inversion models were created and interpreted cavity zones (from very high resistivity – Red color) into three cases as follows The test results using electrical method of geophysical exploration are as follows
1)Pseudo 3D models obtain from three lines of 2D sections use both Dipole-Dipole and Schlumberger array as shown in Figure 17 and 19 for Plot A area. and Figure 27 and 29 for Plot B Area. Then 3D cube models are further displayed with limit very high resistivity zone (present as Cavity zone) as shown in Figure 18 and 20 for Plot A area. and Figure 28 and 30 for Plot B Area.
2)3D S-shape model with Dipole-Dipole array as shown in Figure 21 for Plot A area. and Figure 31 for Plot B Area. Then 3D cube models are further displayed with limit very high resistivity zone (present as Cavity zone) as shown in Figure 22 for Plot A area. and Figure 32 for Plot B Area.
3)3D S-shape model with Schlumberger array as shown in Figure 23 for Plot A area. and Figure 33 for Plot B Area. Then 3D cube models are further displayed with limit very high resistivity zone (present as Cavity zone) as shown in Figure 24 for Plot A area. and Figure

Cavity zone (very high resistivity – red color) found in 3D resistivity Model from S-shape of Plot B area, data obtain from Schlumberger electrode array reading.

Cavity zone (with limit only very high resistivity boundary from 3D s-shape model in Figure 33).

3D S-shape resistivity measurement is successful to apply for locating the boundary of cavity in limestone (particularly at the mine face location). The results also show 2D sections on each survey line which obtain from 3D measuring. The presentation of 3D inversion models can be achieved in 3 types i.e.
1)Pseudo 3D model from both Dipole-Dipole and Schlumberger, processed from 2D section of each survey line
2)3D S-shape of Dipole-Dipole array.
3)3D S-shape of Schlumberger array
Where all these outputs display in some differences of resolution, depth and pattern
To compare 3D models from same location of Plot A,
3D S-shape model with Dipole-Dipole configuration reading displays three cavity zones with dimension of 20 m long x 25 m wide x 15 m thick, 20 m long x 15 m wide x 15 m thick and 20 m long x 20 m wide x 2 m thick.
While 3D S-shape model with Schlumberger configuration reading can show only two main shallow cavity zones with dimension of 25-40 m long x 30-40 m wide x and 10-15 m thick and 40 m long x 30-40 m wide x 15-20 m thick.

Industry-leading geophysical equipments and service provider supplier