

The schematic diagram of the reservoir is as follows:
.jpg")
.jpg")
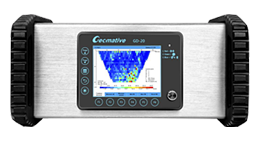
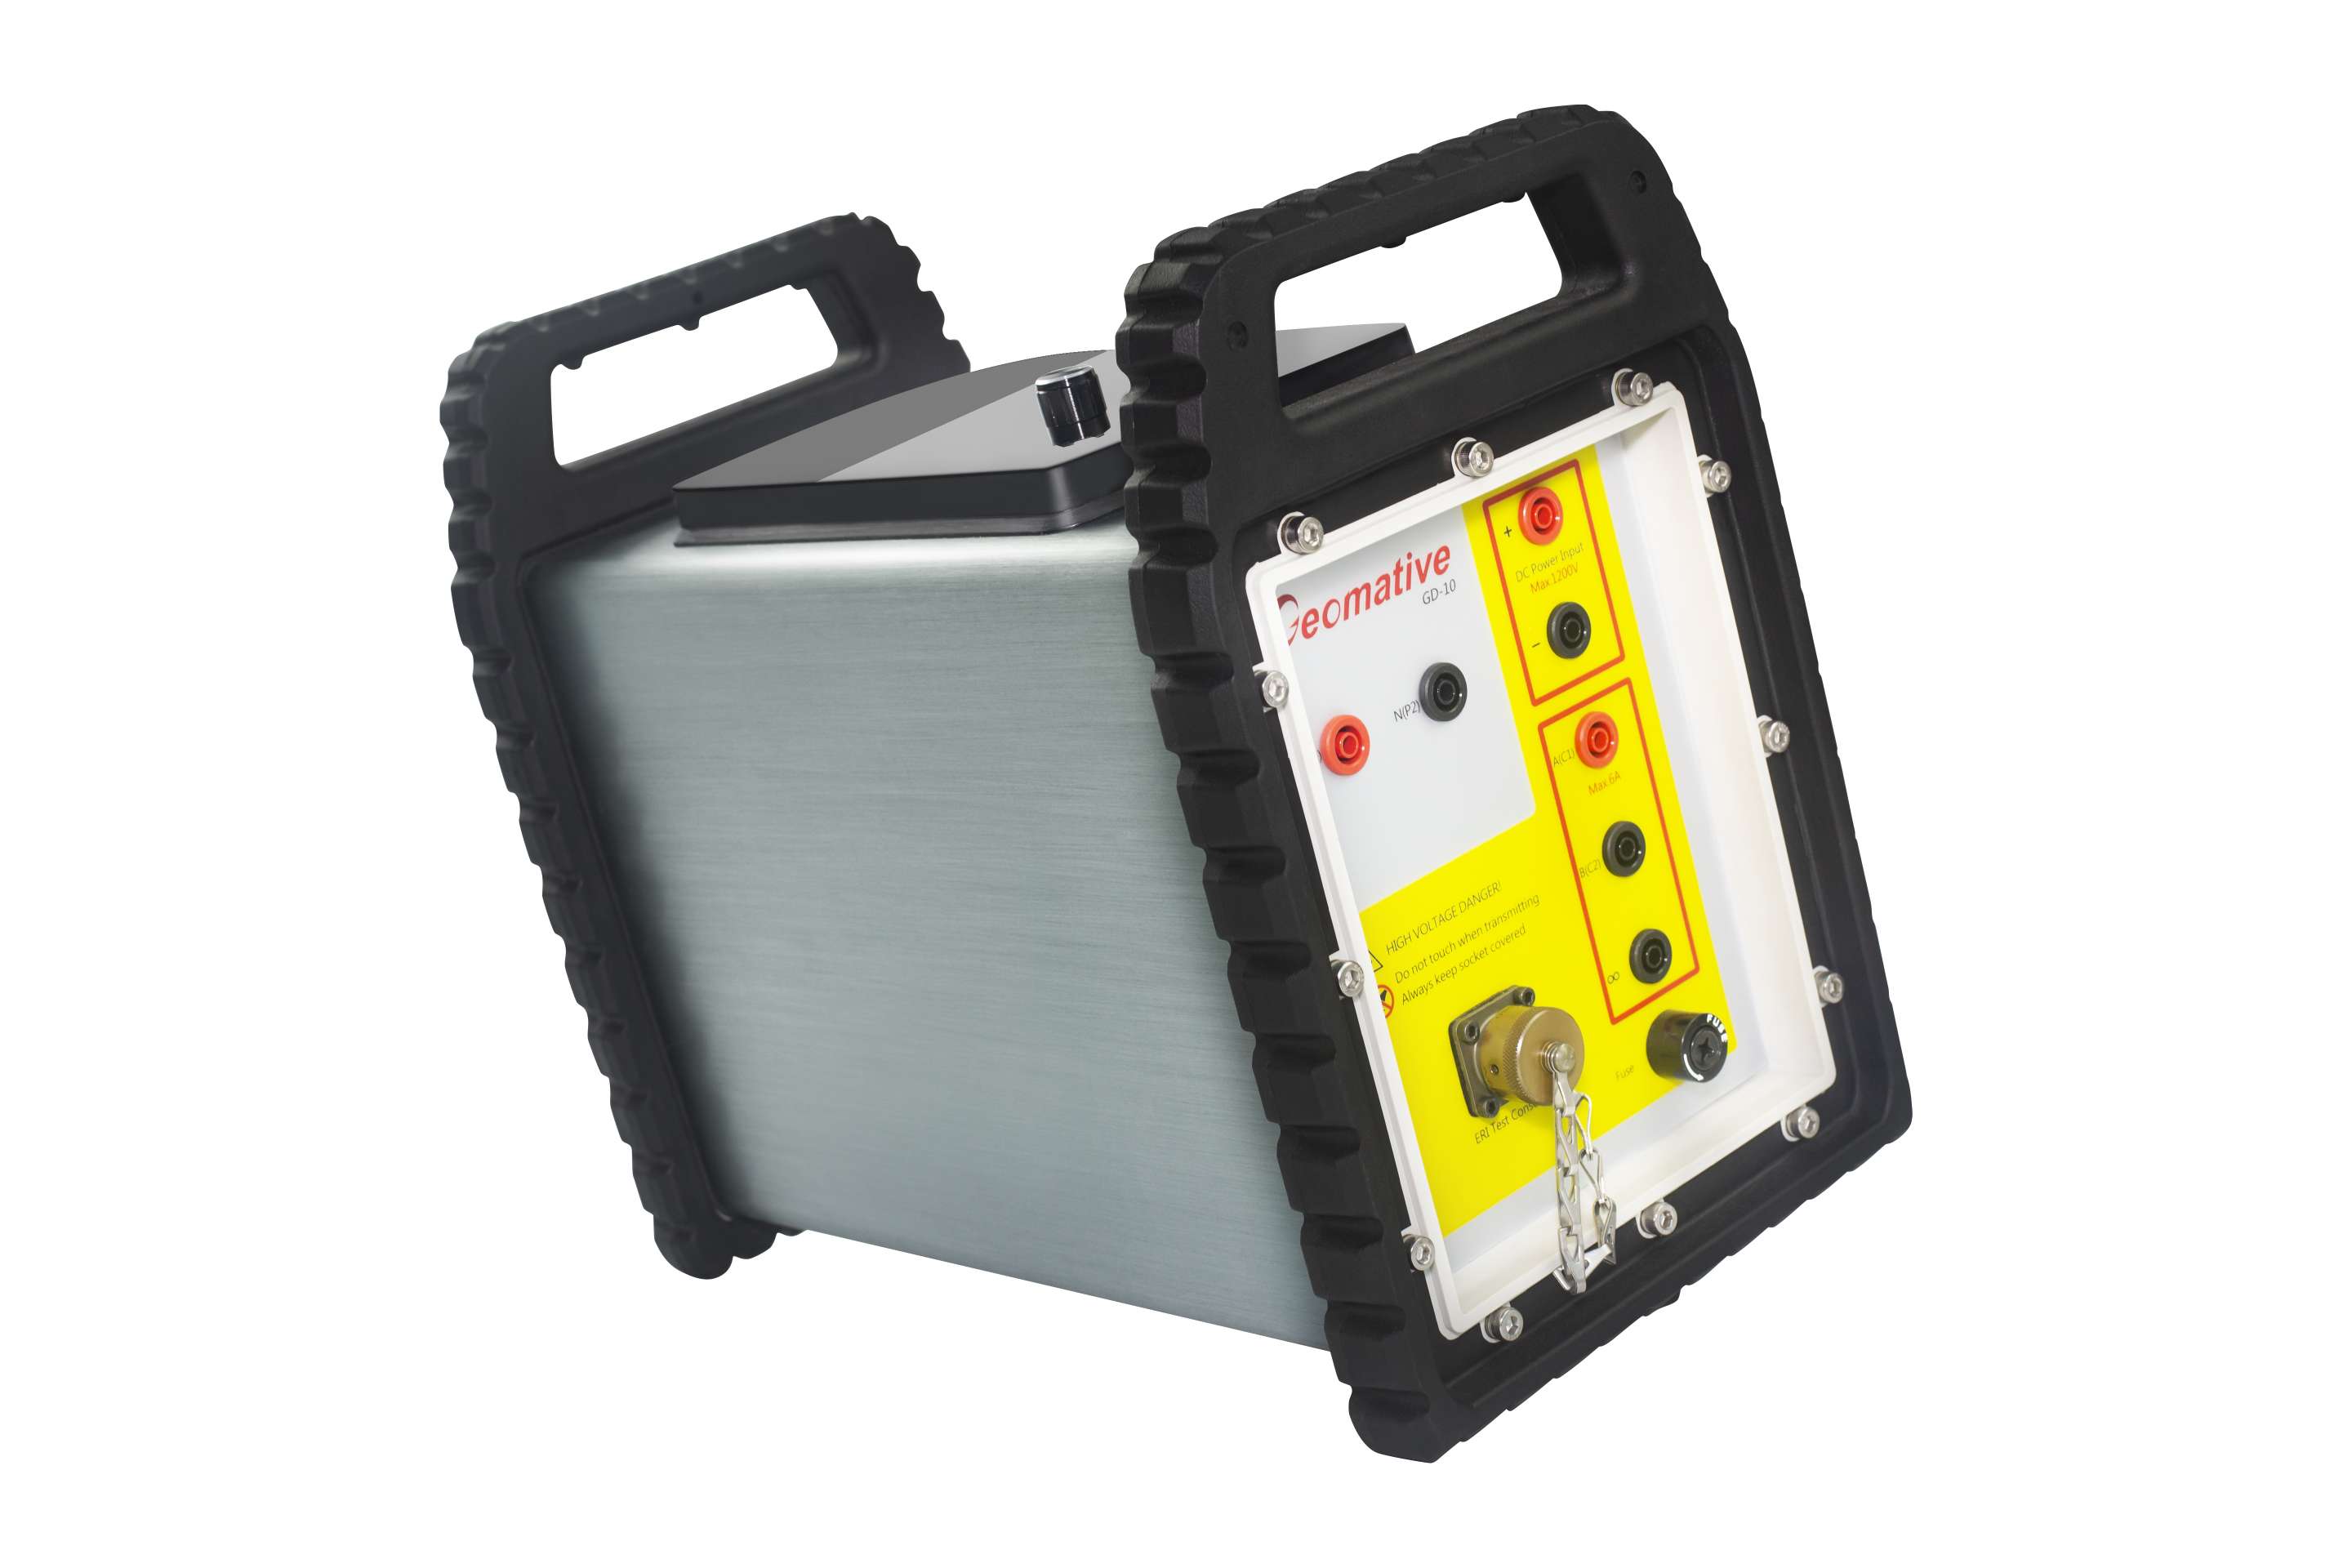
Apply 2D resistivity technique with Geomative (GD-10) resistivity instrument to - Monitoring water level impact on the resistivity after the reservoir impoundment. - Detect the water leakage of the dam in real-time.
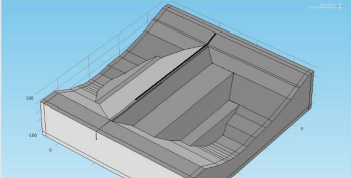
The monitoring section is located at the two sides of the dam, the concrete road is at the top of the dam and 10 meters wide. The dam is filled with rocks in the east side of the dam.


Test network diagram

Field work

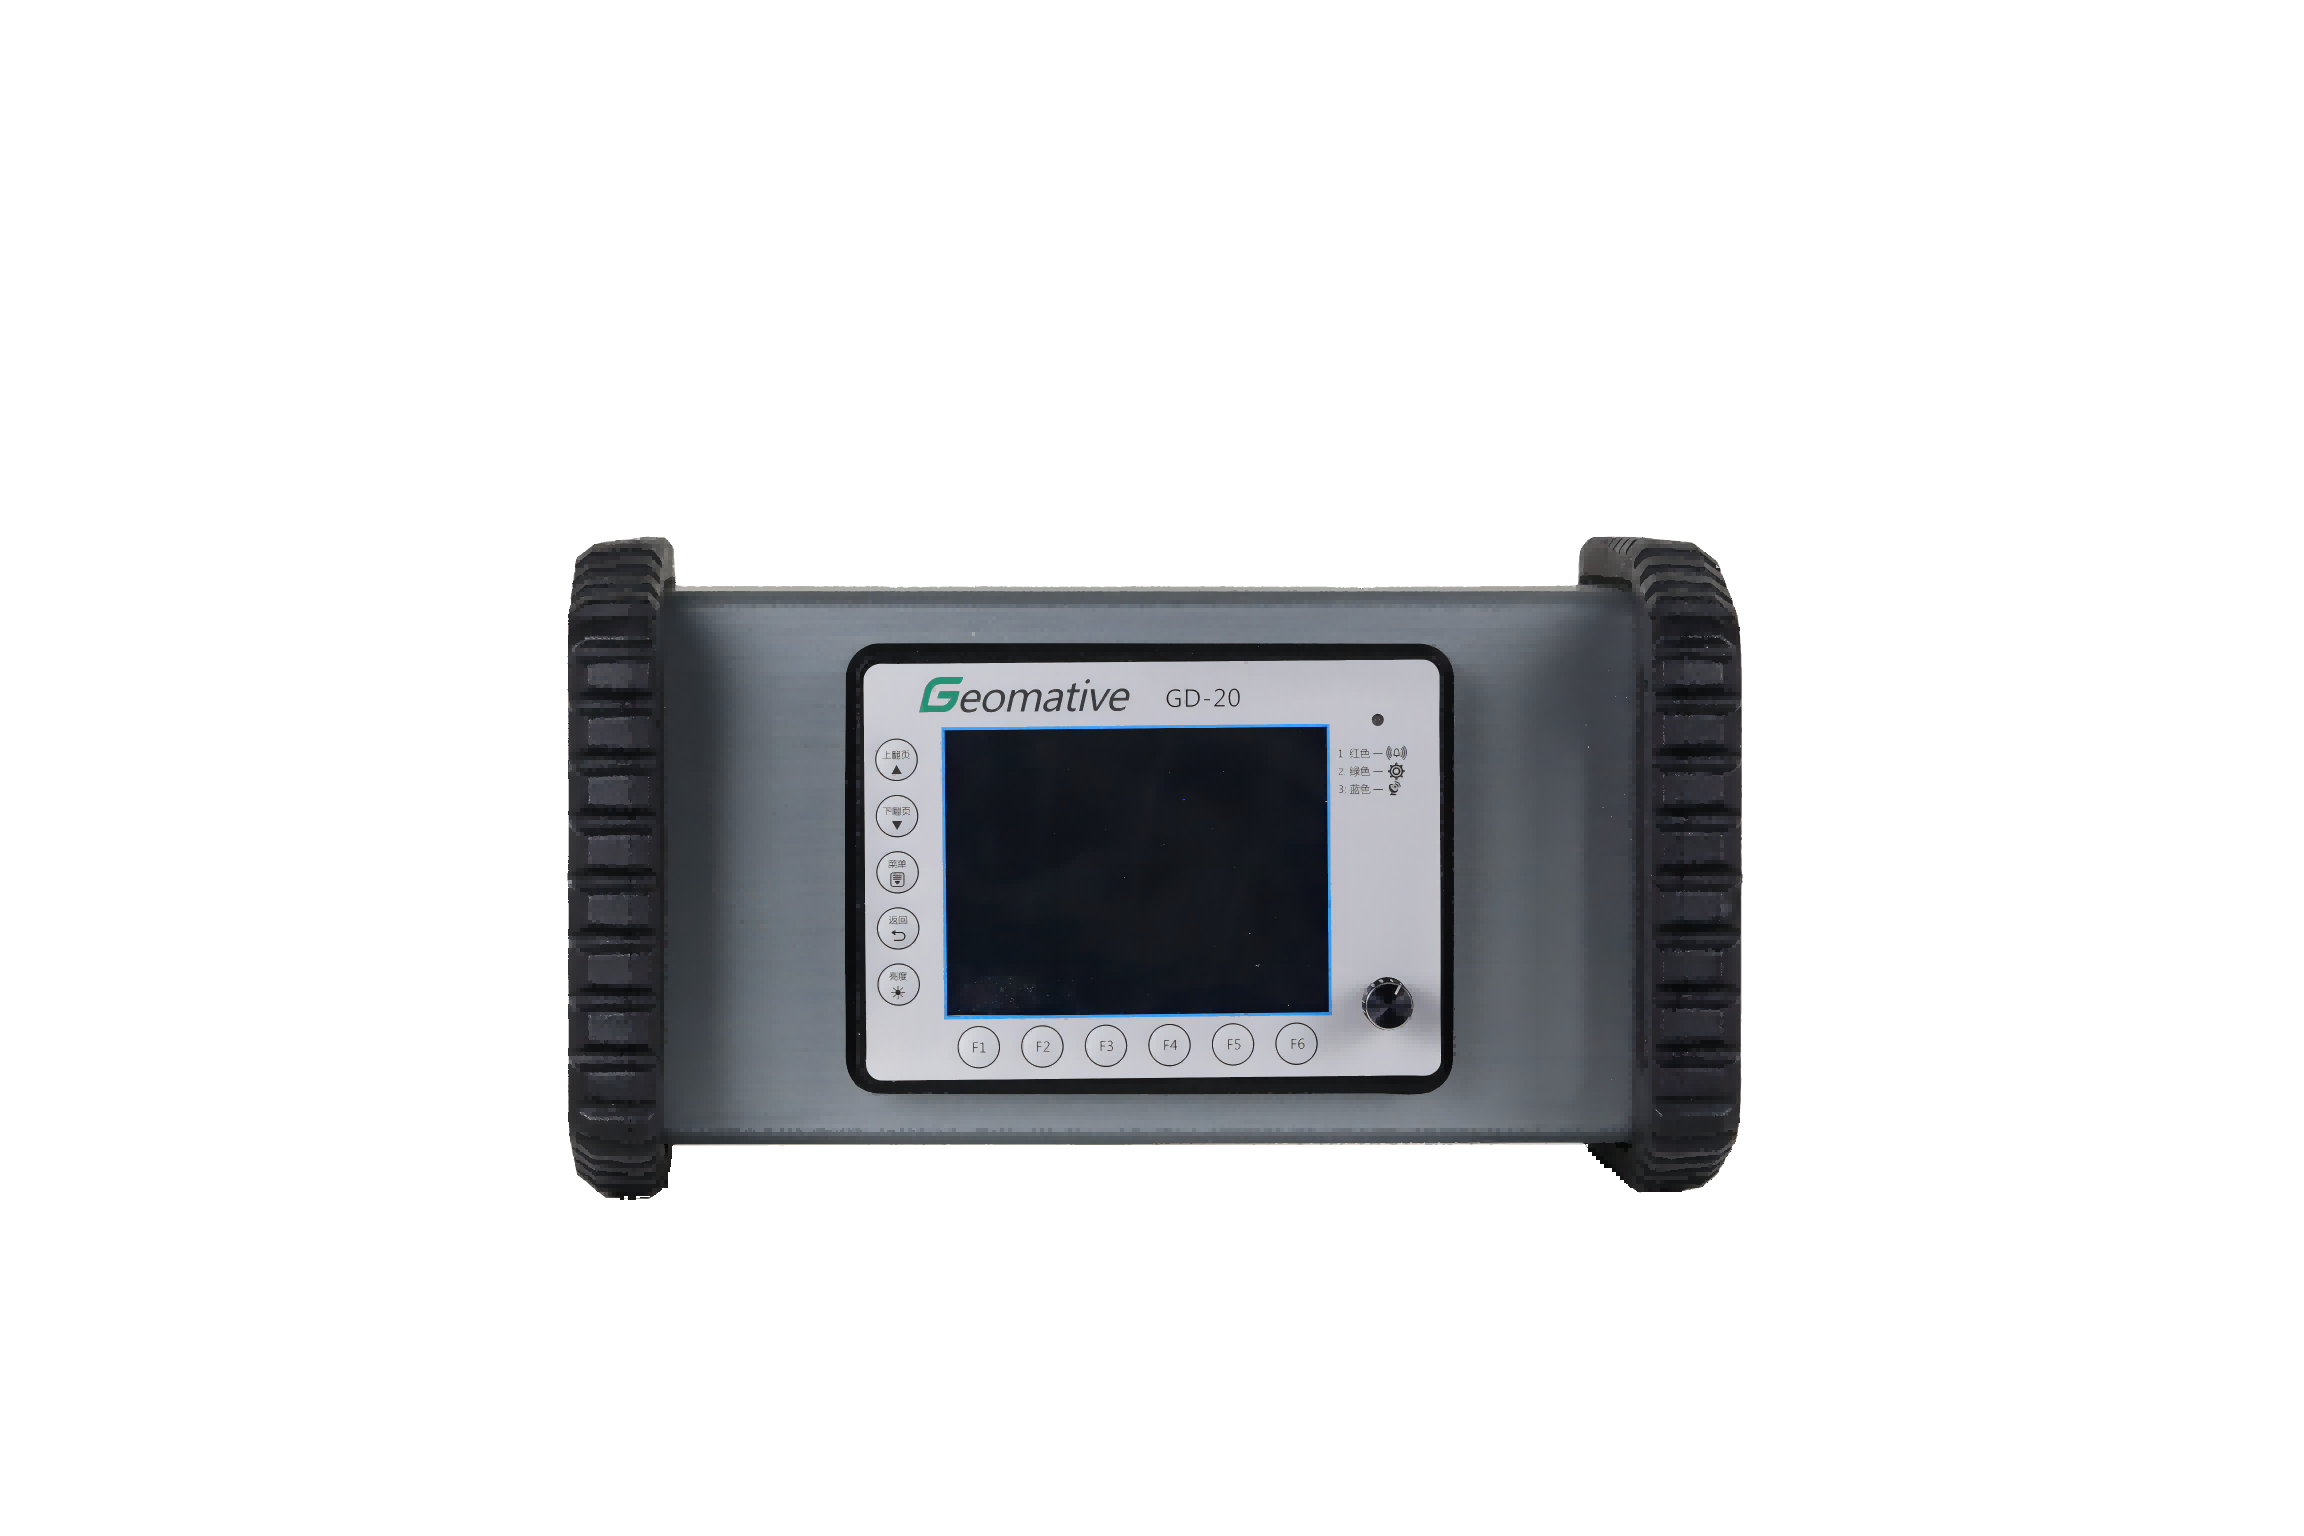
Geomontior Studio

1)As the inverted section shown, the east line of the dam are the red parts with higher resistivity value .which also matches the realities (the sandstone covered place).Meanwhile, the west line of the dam are the green parts with the lower resistivity are Fields and marshes area situation.
2)Above shown section are the background of this monitoring project.It will be compare with in time-test value and situation changing
.jpg")

Industry-leading geophysical equipments and service provider supplier