
Commissioned to conduct oil slick pollution distribution detection for a chemical plant in Beijing, the main objectives are
①Detect the range and depth of oil slick contamination in the site area.
②Verify the test results of MIP on site.
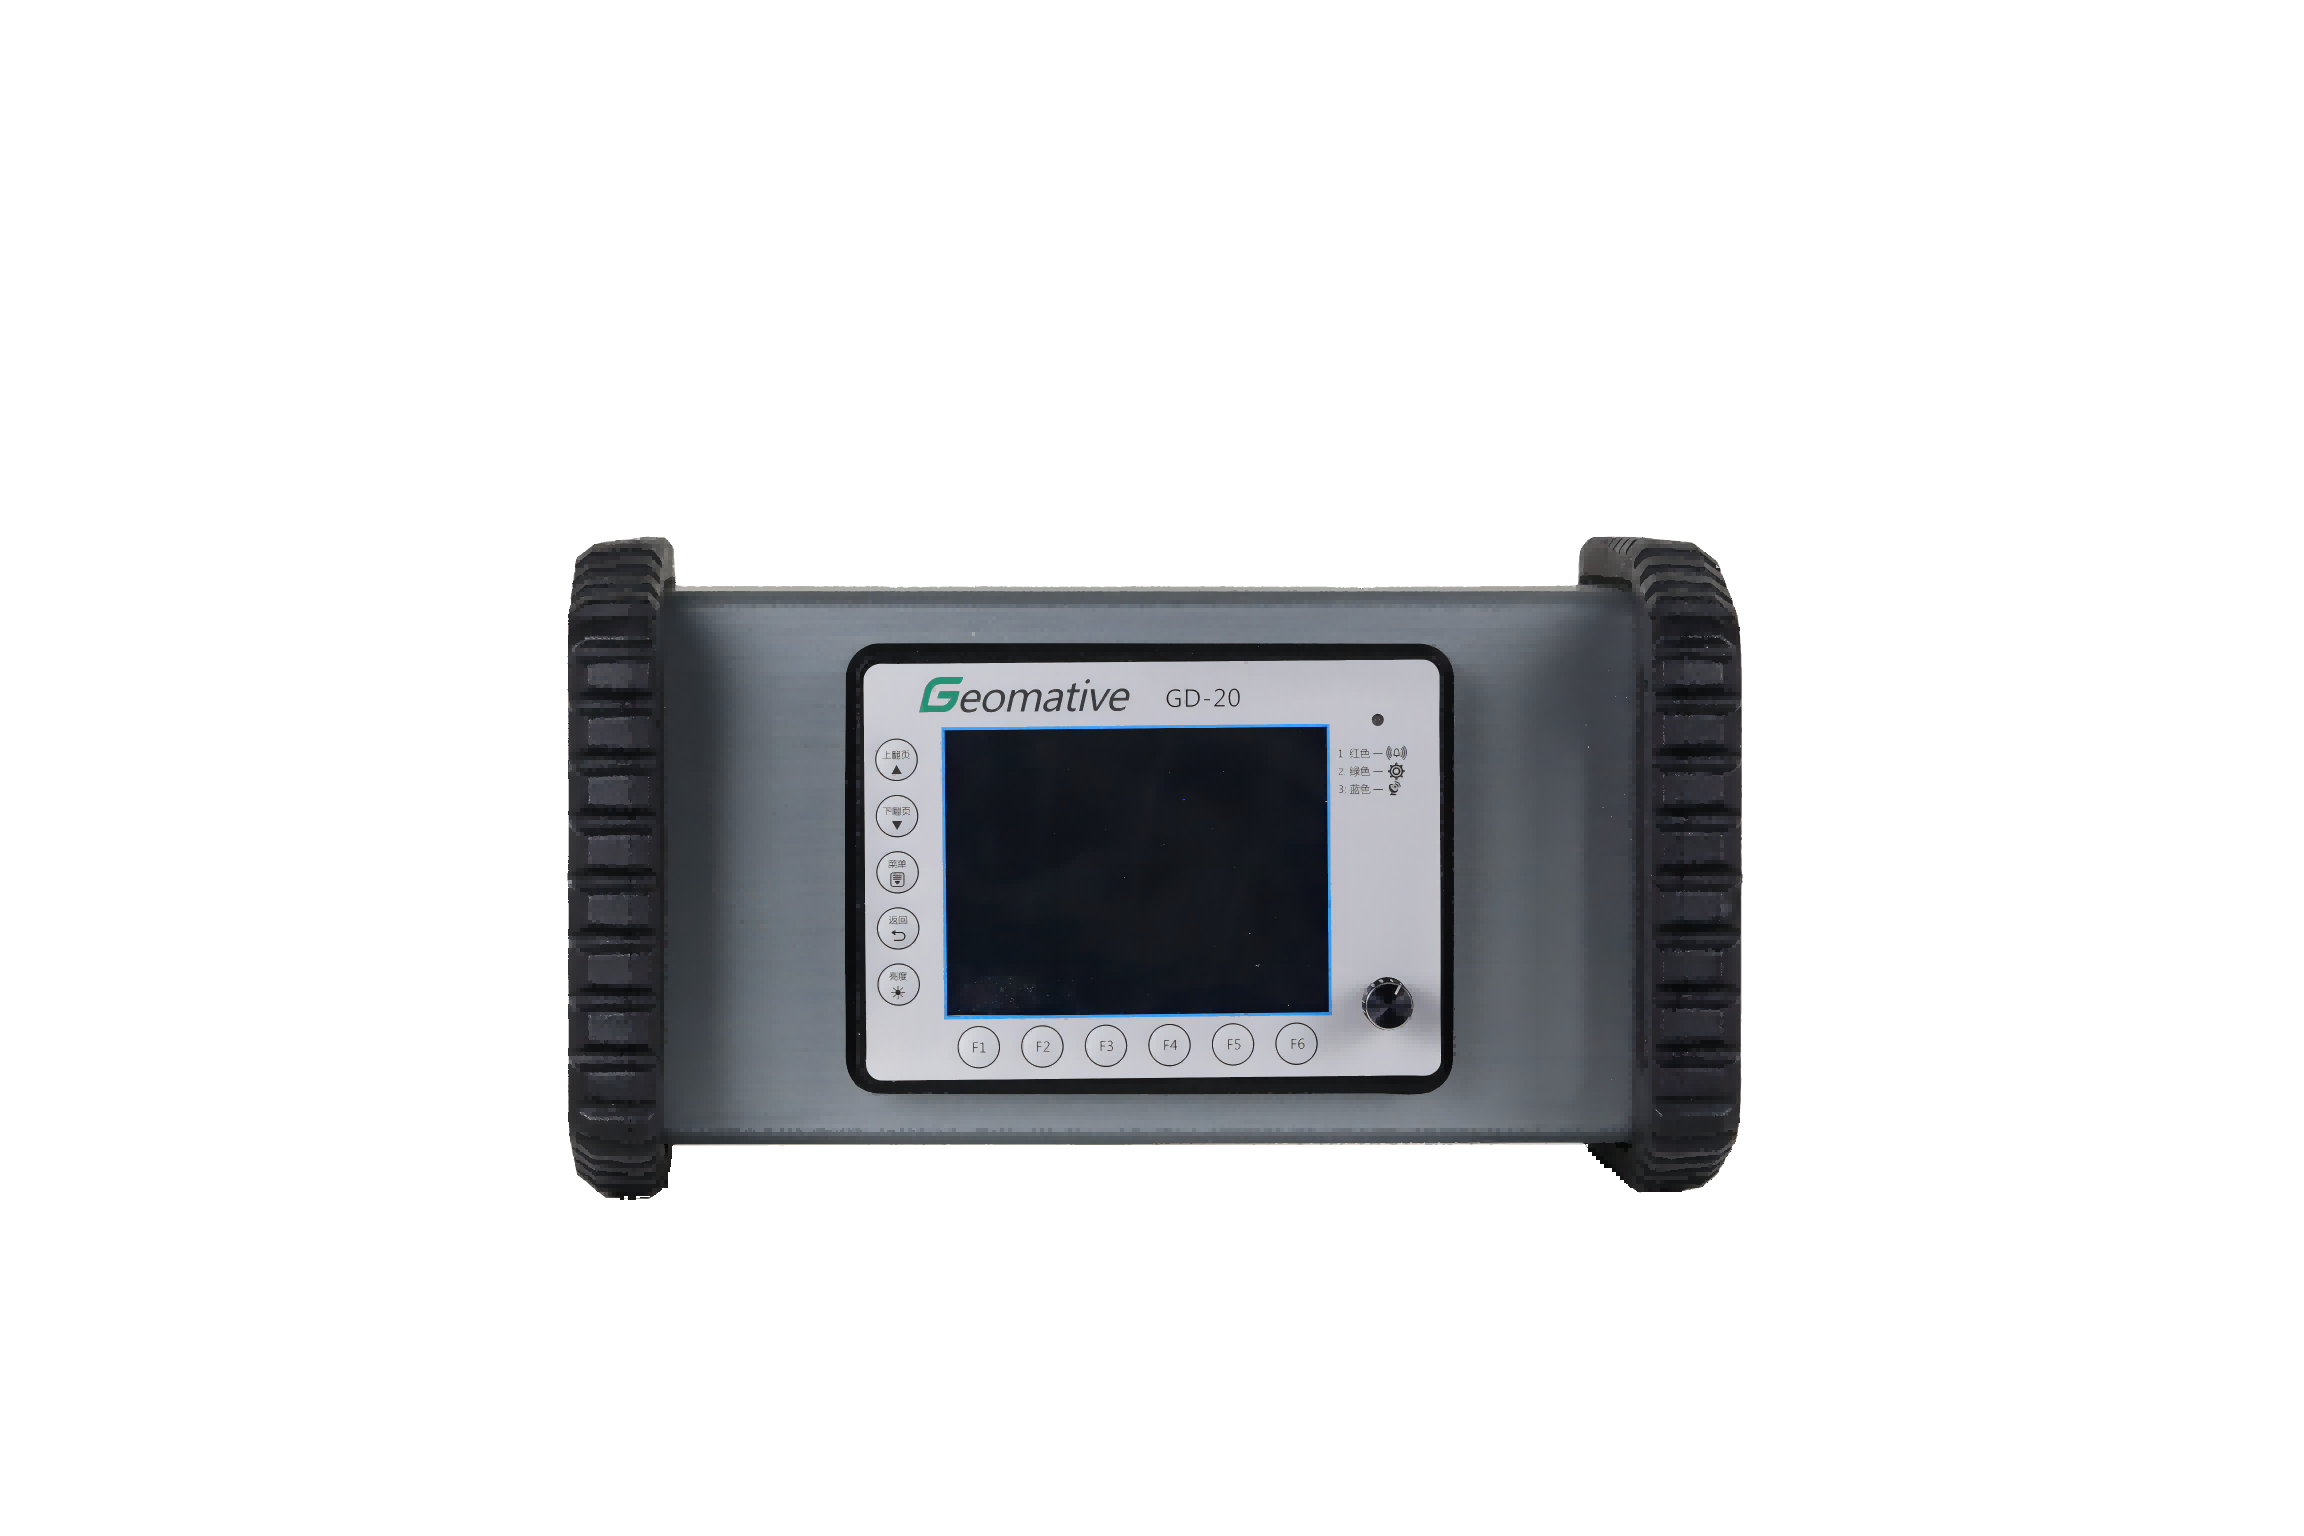
We adopted Wenner-Schlumberger Array for the ERT Survey. The Wenner array has better resolution for horizontal layered structures, and the Schlumberger array is relatively sensitive to vertical structure detection. Spacing between each electrode is 1m, and a total of 6 ERT lines are arranged in the survey area.
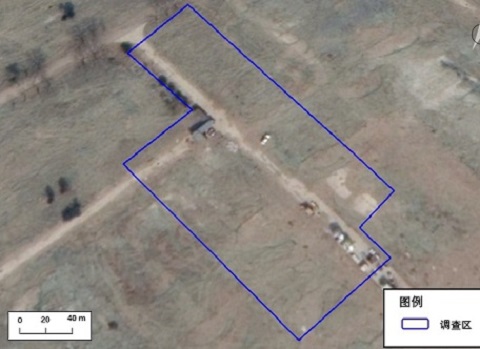
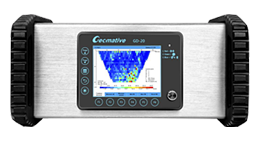
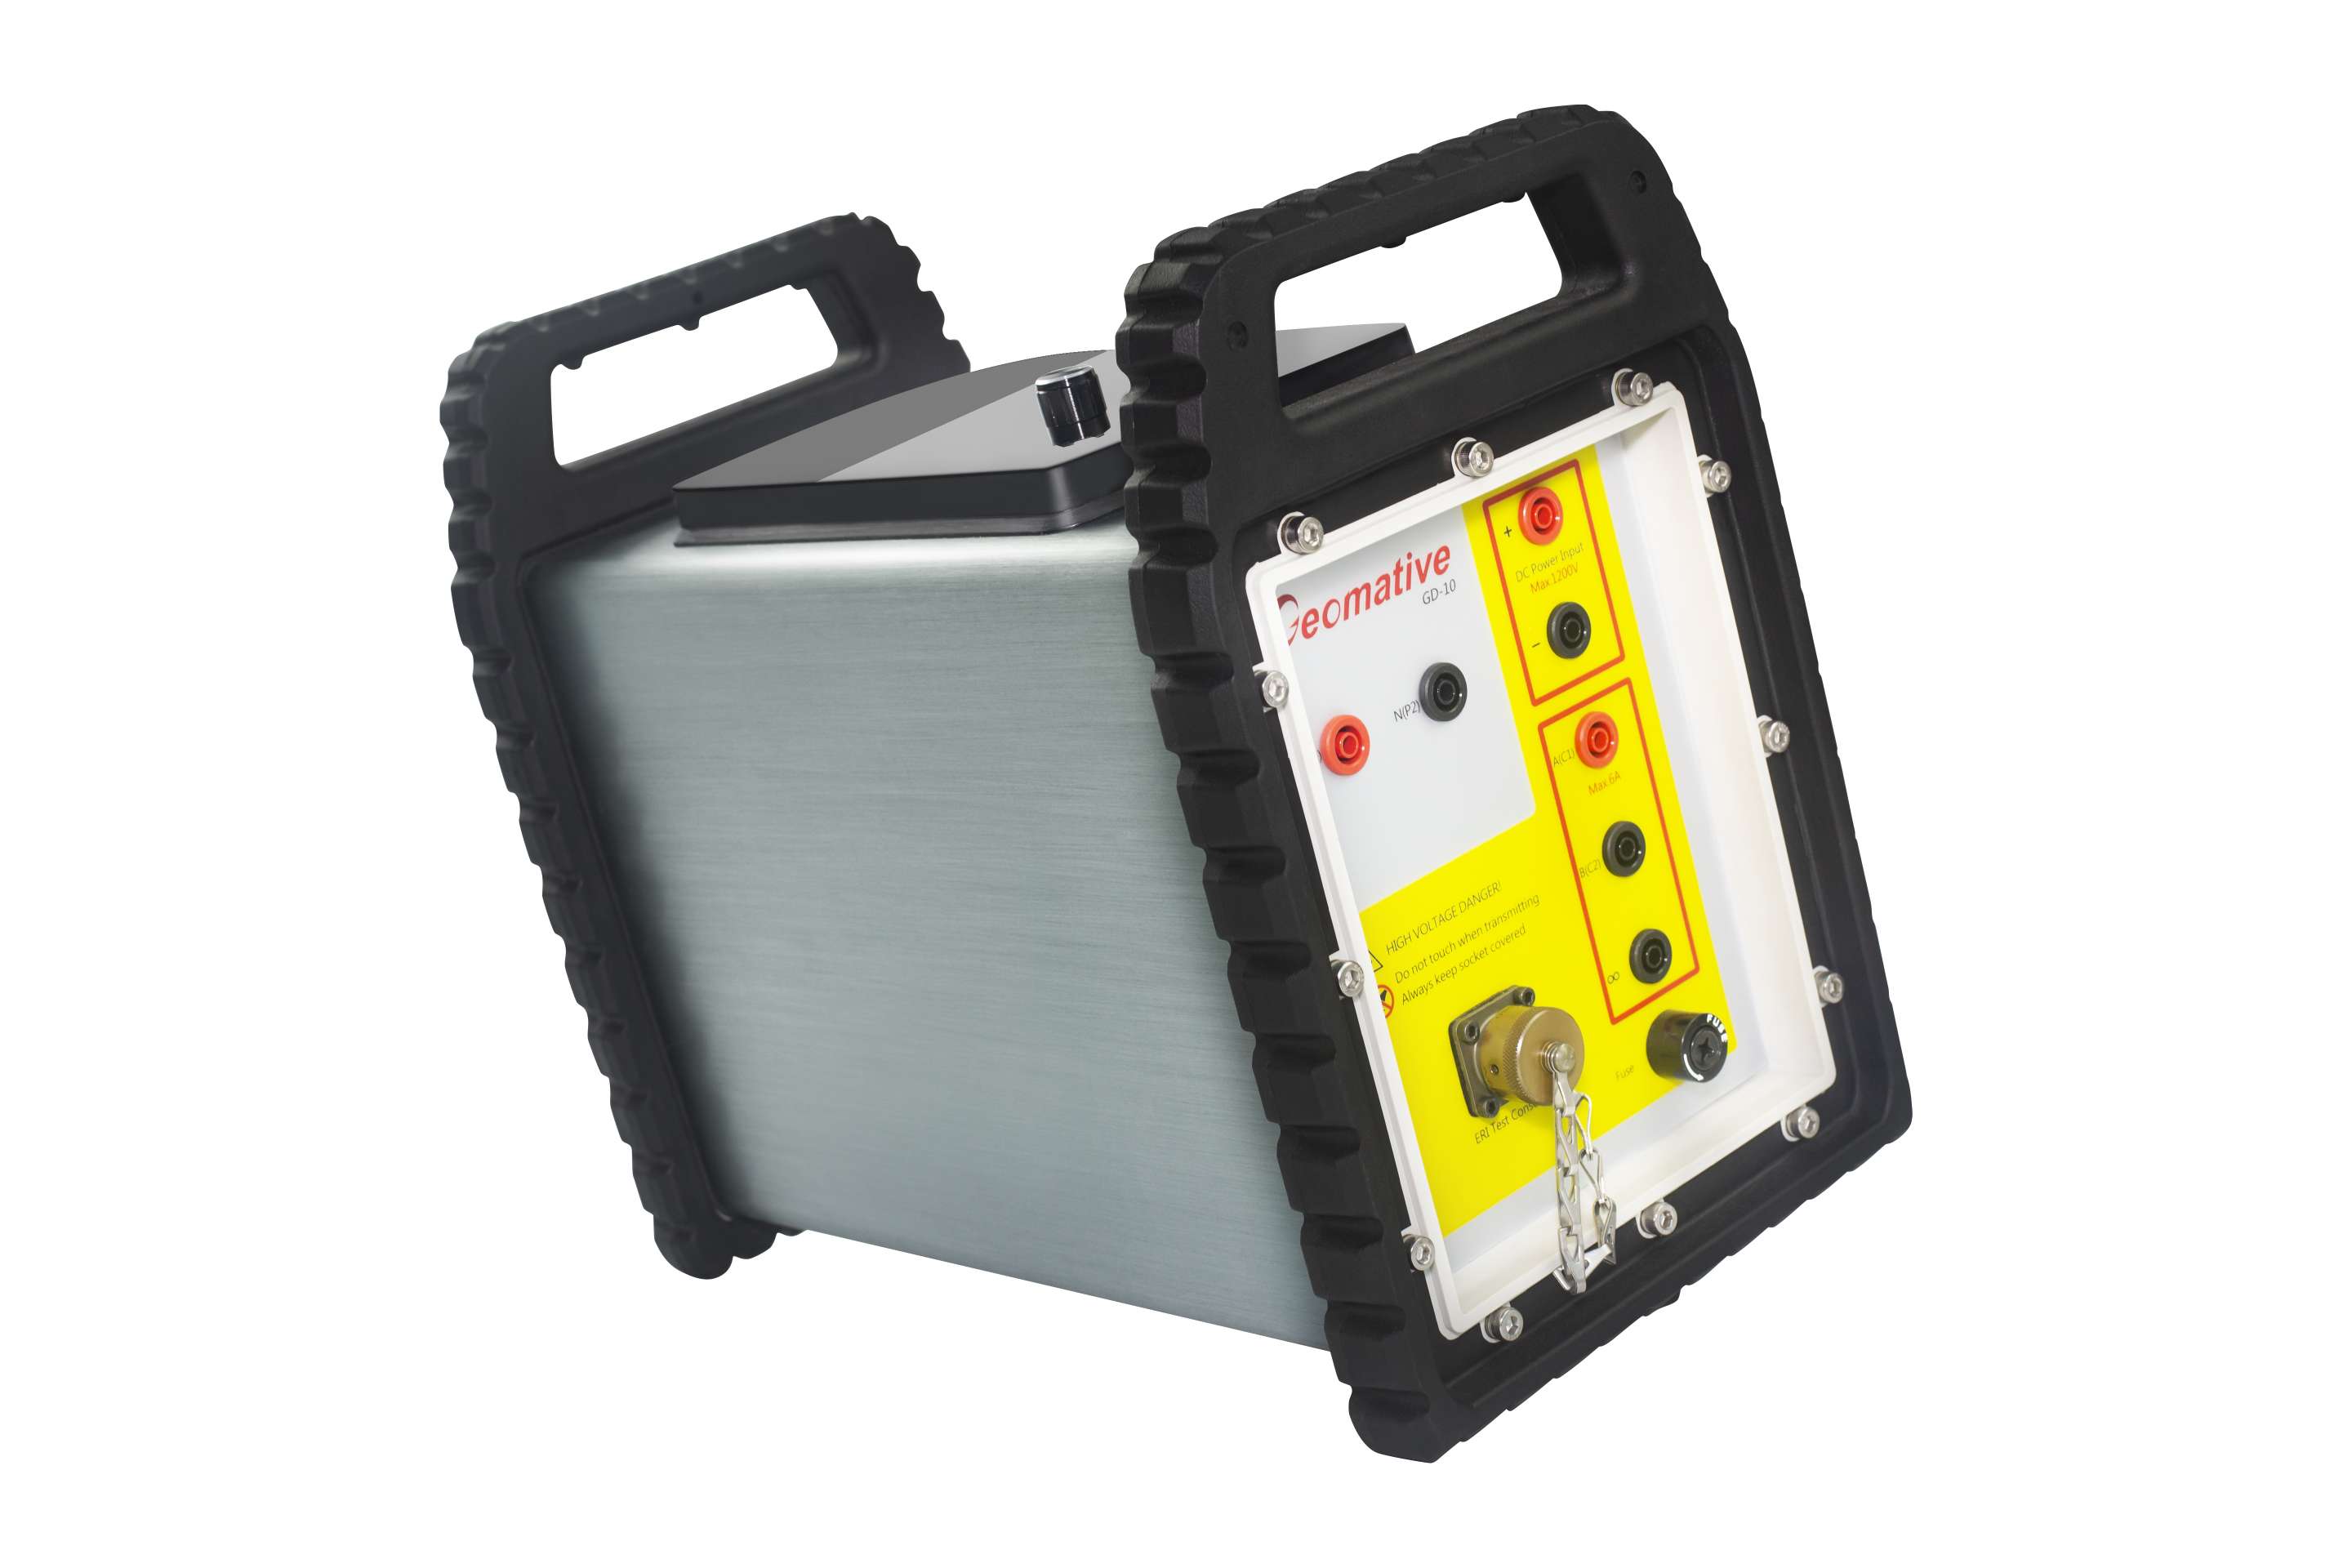
The survey was conducted using the GD-20 high-density electro-method system, and the survey point information was collected using RTK.


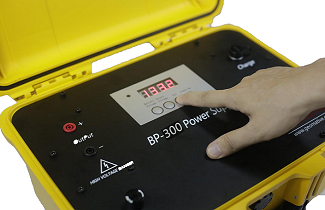
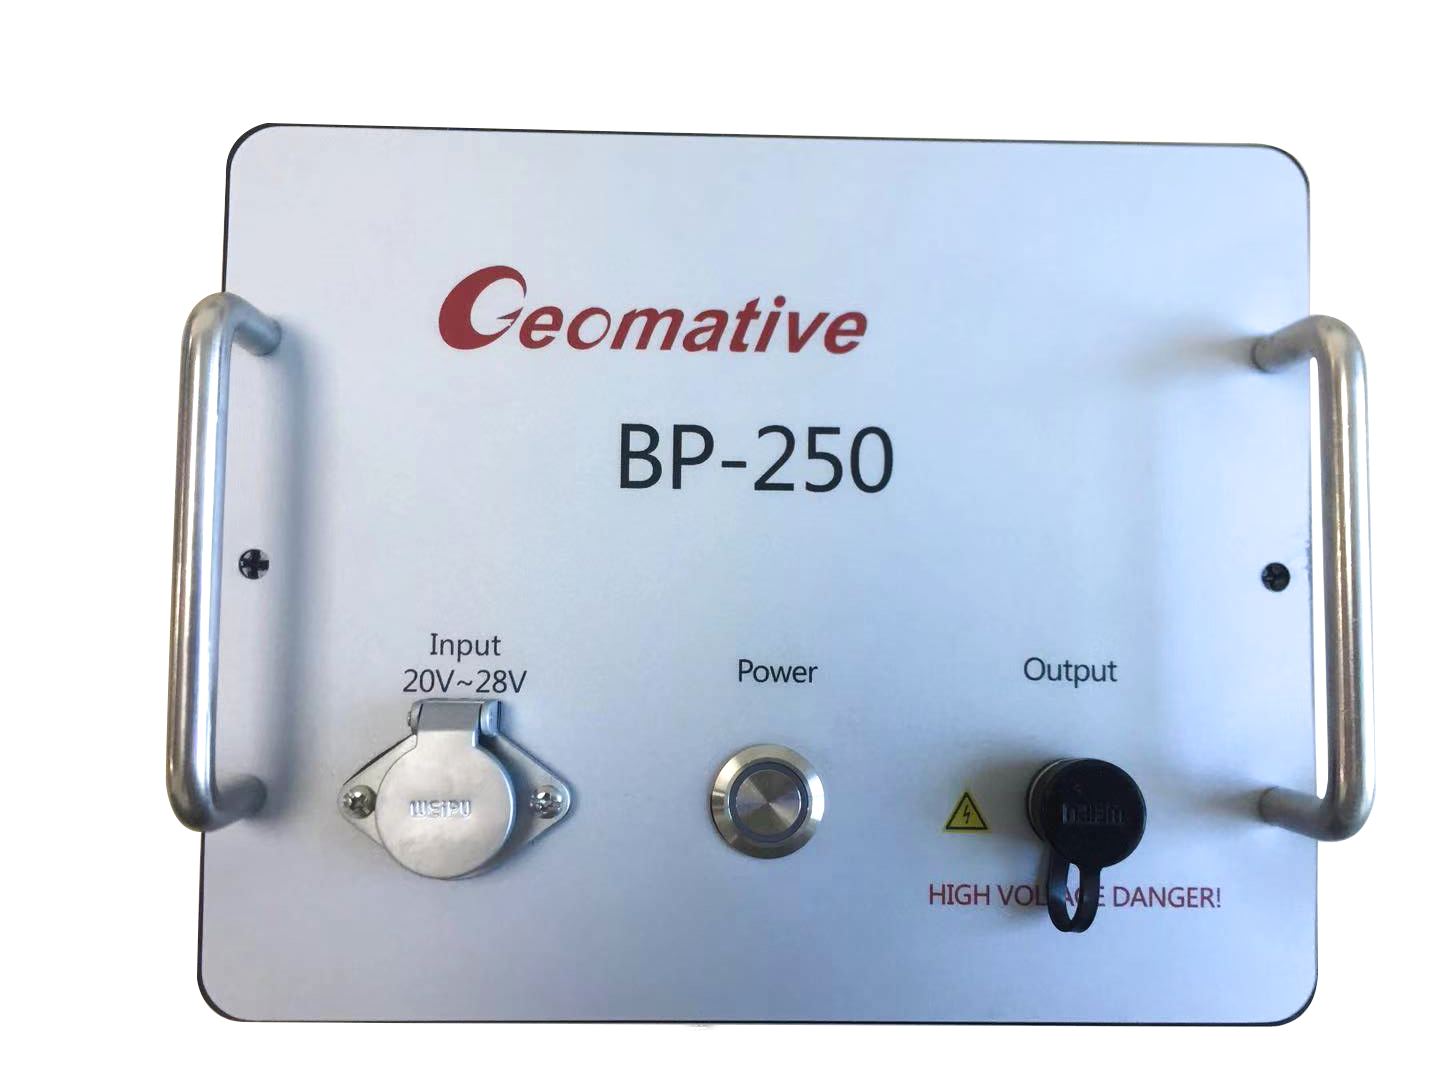
高密度电法系统 BP-450电源
The use of high-density resistivity method to detect the area of large area suspected of oil slick pollution distribution by physical prospecting technology, a total of 6 high-density electrical survey lines with an effective length of 4,000 square meters, can target the scope of the site oil slick pollution, depth, abnormal signal areas and other basic conditions, to provide the owner with complete information on the characteristics of the subsurface.

Layout of ERT survey line in survey area

Field work photos
1.The background ERT results
the resistivity of the entire background is between 21~1000Ohm-m. The electrical resistivity in the longitudinal direction is a "high-low" changing electrical distribution. Therefore, based on the field data and the characteristics of the resistivity medium, it is speculated that the resistivity higher than 1000 ohm-m or lower than 20 ohm-m is an abnormal block.

ERT1 Background Resistivity
2.Interpretation of 2D detection results

The overall line resistivity of the field can be roughly divided into two layers. The first layer is a continuous relatively high resistance layer with a depth of about 0-1.8 meters, and the resistivity range is between 120-500 Ohm-m which may be caused by surface backfill or construction waste. The second layer is below 1.8 meters in depth and the resistivity is less than 120 ohm-m, which is speculated to be an abnormal area. This abnormality is an area where pollution is easy to gather and may be weathered if oil products are contaminated. The average depth of the pollution anomaly is 3-7 meters, the shallowest position of the pollution is about 2 meters, the deepest position of the pollution exceeds the measured depth of the line by 10 meters, and the anomaly is not closed downward.
3.3 Interpretation of 3D detection results

![]()

(a)Section drawing

(b)Section drawing
The average depth of the abnormal distribution of pollution in the investigation area is about 3-7 meters, the deepest is about 12 meters, the depth of the most serious pollution range is about 4-6 meters. Where the resistivity is relatively lowest area, it may be severely weathered oil.。
The distribution of pollution in the survey area is about 1287 m2

Industry-leading geophysical equipments and service provider supplier