
With the development of science and technology, geophysical methods are now intensively used for geotechnical and environmental investigations. Infrastructure development activities in Indonesia are ongoing, where the planning process requires information about the condition of surface and subsurface soil/rock. Underground utility installations often use Horizontal Directional Drilling (HDD) method because it has better flexibility compared to conventional method. This method has the advantage of allowing drilling under the forest; pool; cliff; road; and other conditions that are difficult to reach, unnecessary to restore damaged infrastructure and exposed land due to excavation,not changing landscape conditions and have a lower risk of work.
In the case of HDD done by PT XXX, the pilot head could not penetrate rock layer so the drilling was stopped and required a harder drill bit. Initial prediction is the subsurface rock layer is classified as hard rock, so that information is needed regarding the condition of subsurface layers in that area. To fulfill this information, investigation is needed by observing the condition of soil/rock exposed on the surface, while to determine the condition of soil/rock below the surface it is necessary to do a subsurface geological investigation. In this investigation, 2 (two) methods were used, ERT method and GPR method. ERT method is one of the geophysical methods that can measure the resistivity value of a medium, while GPR method utilizes reflection of signal emitted by the transmitter and received by the receiver. This investigation aims to identify the subsurface condition in Makassar Industrial Area. This is done because each method has limitations, ERT method cannot represent the rock layers well, while the GPR method cannot obtain information about types of rocks below the surface. So that to fulfill the information needed for optimizing HDD drilling, both methods are used to describe rock layers and rock types.
ERT and GPR data acquisition was carried out at Makassar Industrial Area (KIMA), Biringkanaya, Makassar City, South Sulawesi.This research was done in 3 (three) ERT lines, 1 (one) GPR line, and field observation to find some outcrops. ERT method used to obtain information about rocks type, although GPR method used to identify rock layers. GPR method has done only in 1 (one) line because it represents all ERT lines.

Work area of ERT and GPR survey
ERT Method
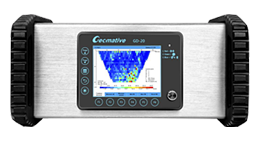
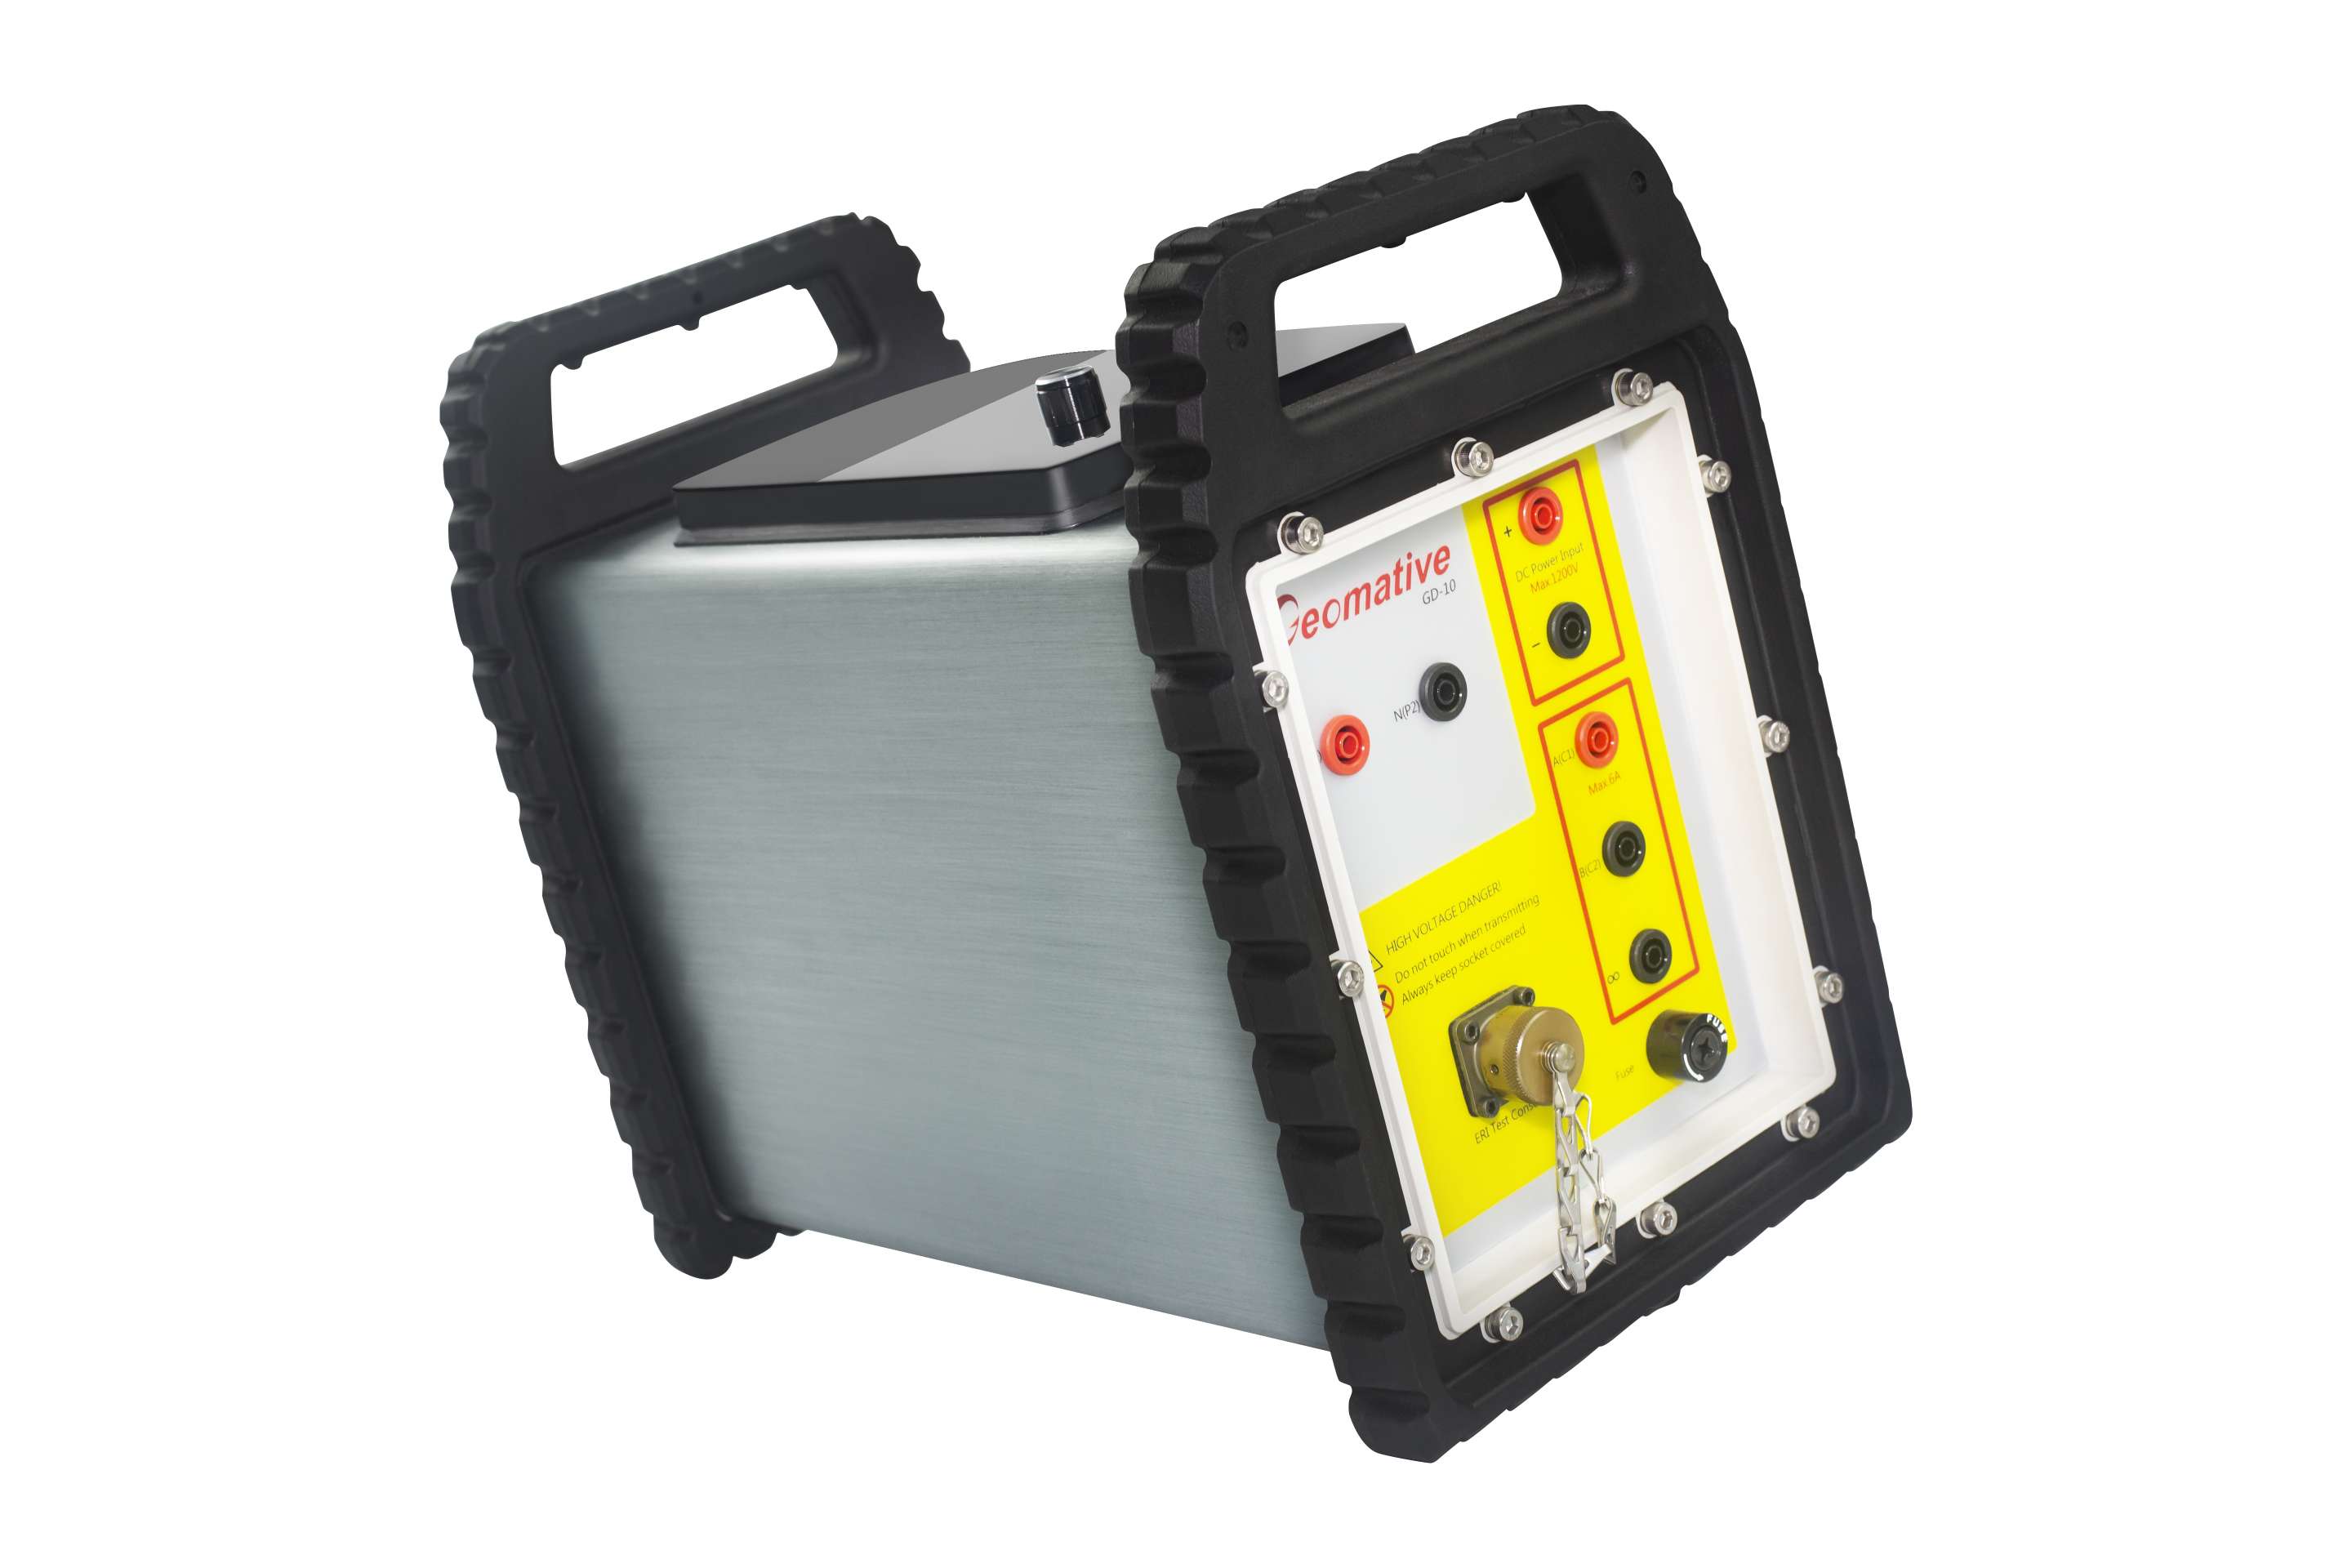
Data acquisition of ERT method using GD-10 Resistivity and Imaging System from Geomative. Length of Line 1 and 3 respectively is 470 m with number of electrodes used is 48, electrode spacing is 10 m, while for line 2 is 360 m with number of electrodes used is 36, electrode spacing is 10 m. Electrode configuration used is Dipole-dipole Array. Result obtained from data acquisition is apparent resistivity value. Data processing was done with inversion method using software RES2DINV. Final result from data processing is 2D resistivity section from ERT lines.

ERT Data Acquisition
GPR Method
Data acquisition of GPR method using GroundVue 100 from UTSI Electronics with frequency 100 MHz. Length of the GPR line is 140 m which represents ERT lines. Obtained depth is ±35 m. Result from GPR data acquisition is radargram raw data. Data processing was done with software Reflexw to remove static effect, increase signal energy (gain), and remove the recorded data noise. Final result from data processing is 2D radargram section from GPR line.

GPR Data Acquisition
Interpretation of subsurface layer using ERT method at Makassar Industrial Area (KIMA) is refers to Resistivity of Rocks and Materials Table (Telford, 1990). Identification results of the cross section are as follows:
Table 1. Resistivity of Rocks and Materials

ERT Method Results

Figure1.Line 1 ERT 2D Sectio
Figure 1 is 2D section obtained from RES2DINV. Lower resistivity range (II) given at 1.5 – 10 Ωm with depth of ± 0 – 20 m interpreted as alluvial layer. Middle resistivity range (I) given at 11 – 89 Ωm interpreted as limestone intersects with volcanic tuff with depth ± 0 – 30 m. Higher resistivity range (III) given at ˃ 90 Ωm with depth range ± 0 – 6 m and ± 20 – 70 m interpreted as limestone which has hard physical properties.

Figure2. Line 2 ERT 2D Section
Figure 2 is 2D section obtained from RES2DINV. Lower resistivity range (II) given at 1.5 – 10 Ωm with depth of ± 0 – 10 m and ± 0 – 30 m interpreted as alluvial layer. Middle resistivity range (I) given at 11 – 89 Ωm interpreted as limestone intersects with volcanic tuff with depth ± 2 – 30 m. Higher resistivity range (III) given at ˃ 90 Ωm with depth range ± 3 – 81 m interpreted as limestone. Limestone which intersect to volcanic tuff is from Camba Formation (Tmc)

Figure 3. Line 3 ERT 2D Section
Figure 3 is 2D section obtained from RES2DINV. Lower resistivity range (II) given at 1.5 – 10 Ωm with depth of ± 0 – 15 m and ± 10 – 35 m interpreted as alluvial layer. Middle resistivity range (I) given at 11 – 89 Ωm interpreted as limestone intersects with volcanic tuff with depth ± 0 – 30 m. Higher resistivity range (III) given at ˃ 90 Ωm with depth range ± 0 – 10 m and ± 10 – 70 m interpreted as limestone.
GPR Method

Figure 4. GPR 2D Section (Radargram)
Figure 4 is GPR 2D result that represent rock layers. From the result above, there are 3 (three) layers. Based on GPR result that represent subsurface conditions at ERT Line 1 – 3 obtained 3 (three) layers based on amplitude variation. After integration with ERT data, layer 1 with depth ± 0 – 6 m interpreted as limestone intersects with volcanic tuff, layer 2 with depth ± 6 – 16 m interpreted as alluvial layer, and layer 3 with depth ± 16 – 35 m interpreted as limestone.
Outcrop Identification
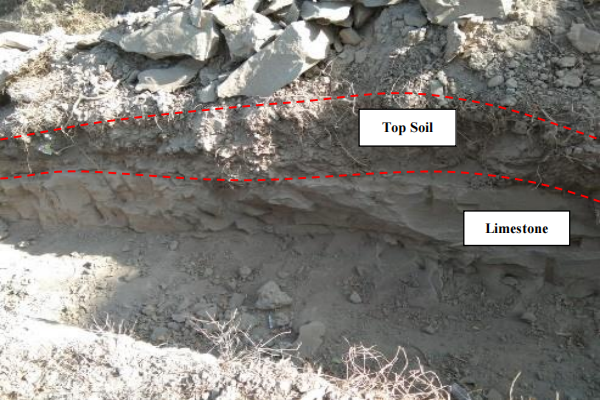
Based on our field observation at work area, we found outcrop at excavated zone. That outcrop identified as soil at first layer and limestone at second layer with depth ± 60 cm and estimated continue to ± 6 m. This limestone outcrop indicated as the limestone layer which intersects with volcanic tuff. This outcrop validates ERT and GPR result that the limestone layer was found at top layer of the rock layers. Based on all those results above, subsurface conditions can be described as 3 (three) layers (Table 2)
Figure 5. Limestone Outcrop
Table 2. Final Result

From the results of ERT and GPR methods, we can conclude that:
1. Material contained in work area is indicated as alluvial layer in the form of sandy clay with depth ± 6 – 16 m and resistivity value ± 1.5 – 10 Ωm, marine sediment deposits in the form of limestone intersect with volcanic rocks with depth ± 0 – 6 m and resistivity value ± 11 – 89 Ωm, limestone with depth ± 16 – 35 m and resistivity value ˃ 90 Ωm.
2. Limestone outcrop was found in work area. Based on that outcrop, limestone was found at depth of ± 60 cm and estimated continue to ± 6 m depth. This indicates that ERT and GPR results are suitable with the field conditions.
3. Based on the result of ERT and GPR methods that can represent the subsurface rock layers and rocks type well, HDD planning and activities will be optimal.
4. This combination of ERT and GPR methods purposed to produce a more detailed imaging of a layer.

Industry-leading geophysical equipments and service provider supplier