
Geomative
  • Products
    • Resistivity and IP Tomography
    • Electromagnetic
    • Integrated Well Logging System
    • Airborne and Ground Magnetometers
    • Geological Online Monitoring System
    GD-12/22/32 1/6/12-Channel Resistivity IP Imaging System

    GD-12/22/32 1/6/12-Channel Resistivity IP Imaging System

    GD22 It integrates modules such as transmission, collection, control and power supply, and possesses capabilities of high-power transmission, high-precision signal collection, full waveform recording, IP induced polarization measurement, etc. Combined with professional acquisition APP and Geometa data platform, it is suitable for various scenarios of electrical exploration operations. It has a high protection level and strong environmental adaptability, and can meet the detection requirements in multiple fields such as geology, engineering and environment.

    GS-30 12-Channel Electric Receiving Station

    GS-30 12-Channel Electric Receiving Station

    GD-10 Electrical Resistivity & IP Imaging System

    GD-10 Electrical Resistivity & IP Imaging System

    The GD10 survey system adopts a modular and scalable hardware platform, enabling the collection of electrical survey data in various scenarios such as on the ground, in tunnels, and underwater. This system has brought a technological breakthrough to traditional engineering geophysical survey operations.

    GD-20 Multi-channel ERT/IP Imaging System

    GD-20 Multi-channel ERT/IP Imaging System

    The multi-channel collection method is more efficient and significantly reduces the construction cost.

    Laboratory Electrical Workstation

    Laboratory Electrical Workstation

    Multi-electrode resistivity imaging for versatile subsurface investigations.

    Learn more
  • DIGspace
    • DIGspace
    • Platform Fundamental Ability
    • Technical Methods
    • trial application & download
    DIGspace Platform

    DIGspace Platform

    Integrating geological, geophysical, and monitoring data into a unified subsurface cognition system. Deep analysis on desktop, collaboration on web.

    A 3D geospatial platform fusing multi-source survey data with surface spatial information — covering exploration analysis and long-term monitoring.

    Learn more
  • Industries
    • Mineral Resource Exploration
    • online monitoring
    • Cross‑hole investigation
    • Hydrogeological Survey
    • Engineering Geological Investigation
    • Underground Environmental Monitoring
    Brazil Gold Ore Exploration Case

    Brazil Gold Ore Exploration Case

    Carry out geophysical exploration for sulfate zones with potential metal mineral resources in ESTADO DO PARÁ, Brazil, and locate metal ore deposits by electrical prospecting technology.

    Underground water and mineral exploration at Beishan Lead-Zinc Mine, Hechi, Guangxi

    Underground water and mineral exploration at Beishan Lead-Zinc Mine, Hechi, Guangxi

    Integrated geophysical solutions for mineral prospecting.

    Learn more
  • Support
  • About Us
中文Talk to an Expert
  • Products
  • DIGspace
  • Industries
  • Support
  • About Us
  1. Home
  2. GeoPlatform
  3. Platform Fundamental Ability
  4. Four ends, one platform

Four ends, one platform

Four ends, one platform

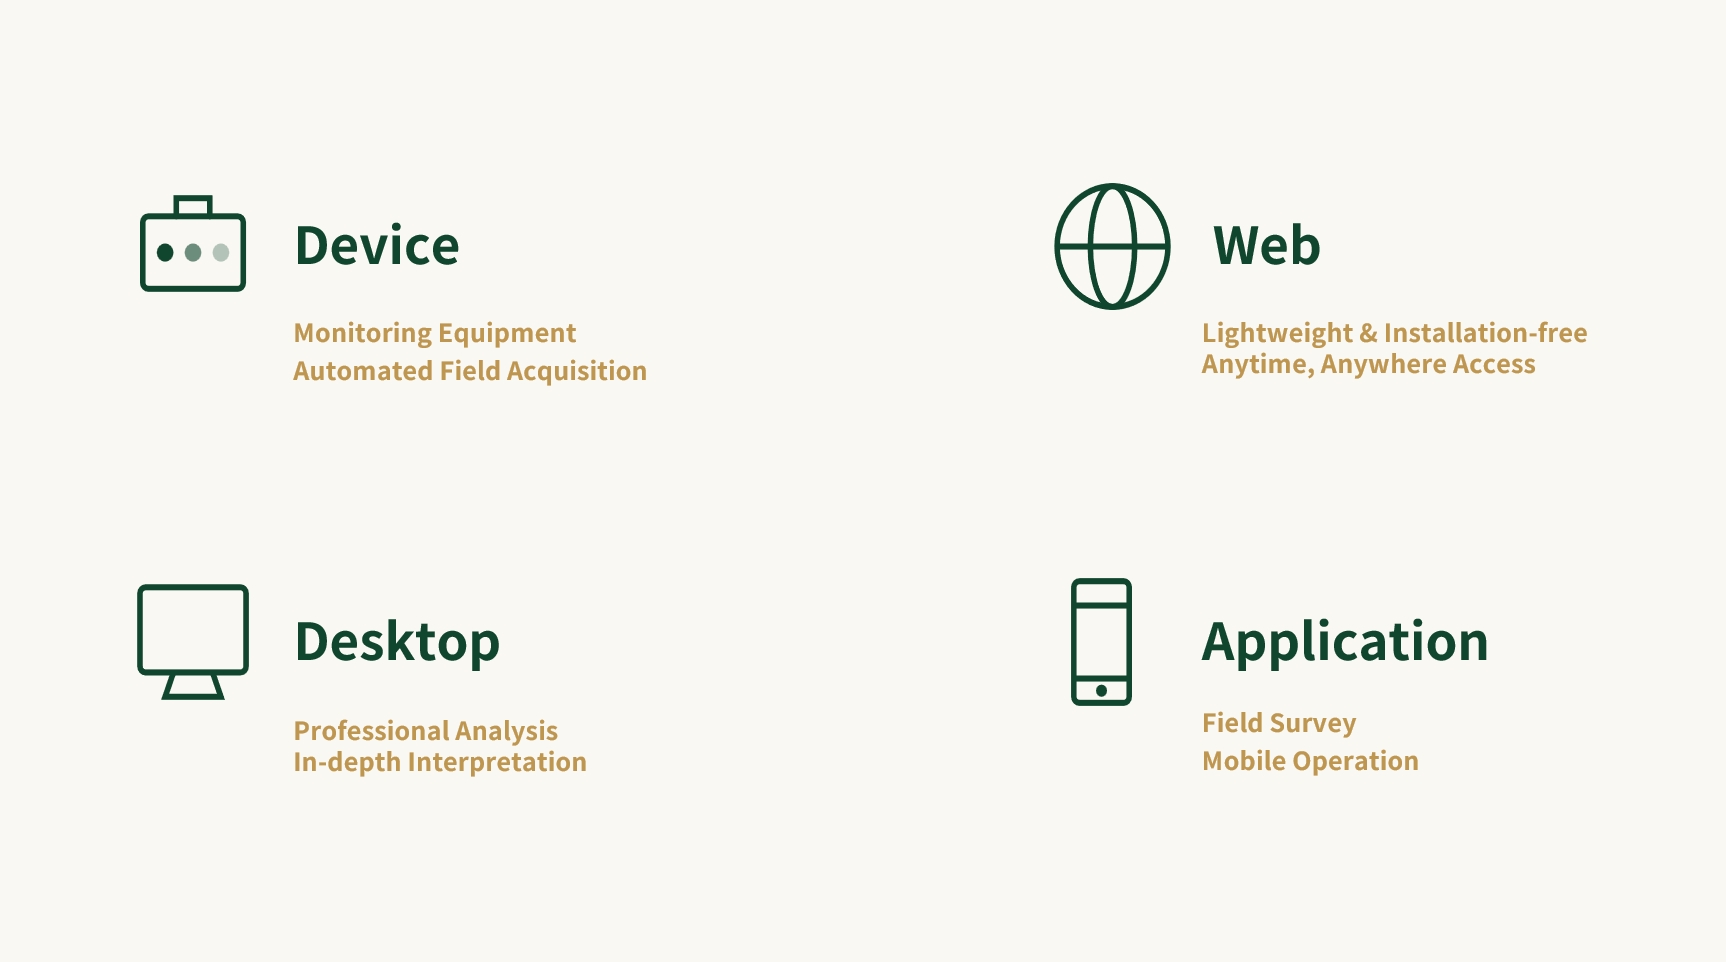
Automatic edge acquisition · collaborative web management · field re-survey on mobile · in-depth desktop interpretation — one account, one project, one data set covering the full lifecycle from investigation to monitoring.

Request a trial
Capabilities
Capabilities

Professional geoscience analysis workbench

Fuse multi-source geoscience data and complete data processing, professional analysis, anomaly identification and integrated interpretation in one unified 3D space.

Professional geoscience analysis workbench

Actual working interface of the DIGspace desktop client

Actual product UI · desktop client (project tree / data sets / layer management / 3D view / properties panel)

01

Multi-source data fusion

02

In-depth spatial analysis

03

Integrated interpretation

04

Professional production

Multi-source data fusion

Bring every dataset into one space — geoscience data from different sources and formats is ingested uniformly and organized and presented under one spatial reference framework.

Unified multi-source data ingestion

Supports unified ingestion of heterogeneous multi-source data including electrical ERT, GPR and borehole logs, fused and presented in one 3D space.

Engineering drawings registered to the background

Import DXF / Shapefile / GeoJSON / terrain / remote-sensing imagery / legacy documents to build a unified coordinate system and engineering context — the spatial reference for all survey data.

In-depth spatial analysis

2D profiles and 3D volumes work in tandem; each data type has the analysis view that suits it best, all cooperating in the same space.

Integrated 2D / 3D analysis

Supports linked views of 2D profiles, 3D volumes, slices and borehole columns; data switches freely between 2D and 3D for coordinated analysis.

VTK 3D volume rendering

Real-time volume rendering on the VTK engine, supporting 3D volume construction, slicing in any direction, contour surface extraction and linked multi-object analysis.

Integrated interpretation

From single-method analysis to integrated multi-source interpretation, making anomalies identifiable, trackable, verifiable and evolvable.

Multi-method joint interpretation

Spatial association and cross-validation of ERT, GPR, borehole and other survey results — upgrading single-method analysis into integrated multi-source interpretation.

Full-lifecycle anomaly management

Discover → delineate → classify → attribute → track → verify → status management. ERT tracks seepage changes; GPR maps distress distribution.

Batch data processing

Batch import and process multiple survey lines and sections, reuse processing-parameter templates, and run large data sets in one click — leave the repetitive work to the platform.

Parameter conversion and integrated computation

Conversion, derivation and combination of parameters across datasets, providing a unified data basis for multi-method correlation analysis and integrated interpretation.

Professional production

Turn analysis results into professional deliverables that are manageable, shareable and exportable, supporting engineering report preparation.

Batch processing and automated processing chains

Complex data processing workflows are packaged into reusable processing chains supporting batch jobs and automated execution — from raw data to finished maps and figures in one click.

Professional deliverable generation

Supports generation and export of anomalous bodies, profiles, 3D models, analytical figures and thematic deliverables, supporting engineering inspection and report preparation.

One-click engineering report

Processing parameters, maps and anomaly conclusions flow automatically into standardized engineering reports generated in one click — freed from screenshots, layout work and manual transcription, with machine generation eliminating copy errors.

Data asset accumulation

Analysis results are stored structurally — traceable, reusable and open to secondary development; survey data becomes an accumulable digital asset.

Desktop · three signature capabilities

The core competencies behind a professional analysis workbench.

Different views, one dataset

Integrated 2D / 3D analysis Linked views of 2D profiles, 3D volumes, slices and borehole columns. 2D data is not forced into 3D; 2D and 3D become different analytical views of the same data object — for more efficient professional analysis.

From single methods to integrated interpretation

Multi-method joint interpretation ERT low-resistivity anomalies + GPR reflection anomalies + borehole lithology ground-truthing — multi-method results link and cross-validate in one space into a unified anomaly object, making interpretation more reliable.

Hand repetitive work to the processing chain

Automated processing chains Complex processing flows are packaged as reusable processing chains with batch tasks and automated execution. From raw-data import to deliverable-map output in one click; parameter templates are reusable and chains can run as overnight batches.

Geoscience data and dynamic monitoring platform

Aggregates engineering geoscience data and connects real-time monitoring with spatial information, keeping project status continuously visible.

Geoscience data and dynamic monitoring platform

DIGspace web platform monitoring overview

Actual product UI · web platform monitoring overview (device status / monitoring data / threshold alerts)

01

Project space

02

Dynamic monitoring

03

Engineering status

04

Collaboration & sharing

Unified project space

Vector drawings + remote-sensing imagery + terrain + survey data + monitoring data all enter one coordinate system — no more switching between multiple software packages.

Project spatial foundation

DXF / Shapefile / GeoJSON, terrain, remote-sensing imagery and project documents build a project space under one coordinate system, all data sharing one spatial reference.

Multi-source data aggregation

Desktop analysis results, online monitoring data, sensor feeds such as GNSS / water level / rainfall, and documents keep flowing into the project space for centralized management.

Dynamic monitoring

Multi-sensor real-time connection with automatic acquisition and ingestion; monitoring data and threshold alerts are always available in the browser.

Monitoring data viewed online

Multi-sensor connection and automatic acquisition; device status, monitoring curves and latest inversion results visible at a glance, continuously ingested into the cloud time-series database.

Anomalies and alerts

Multi-level threshold configuration, multi-channel alert push (SMS / email / in-site message); anomalies sync to mobile for re-survey, with trackable, closable status.

Engineering status

Unified multi-project management; progress, data results and monitoring alerts on one screen.

Unified multi-project management

The project overview dashboard centralizes progress, raw data and inversion results across projects, giving an at-a-glance command of the engineering situation.

Monitoring data dashboard

Centralized display of multi-project monitoring data with scrolling real-time alerts, suited to monitoring centers and meeting-room displays.

Monitoring daily reports generated automatically

Monitoring daily reports are generated automatically from templates with data and maps filled in, producing standardized deliverables fast.

Browser access from any device

Accessible from phone, tablet and desktop browsers with responsive design — the same dataset in the field and in the office.

Collaboration & sharing

Role-based access control, multi-device access and real-time synchronization for distributed teams.

Roles and permissions management

Roles such as administrator / regular user can be customized to your team's internal management, with permissions granted per project and data set, so everyone sees and handles only what they need.

Multi-device remote access

Accessible from phone, tablet and desktop browsers with responsive design. The field and the office see the same data; distributed teams stay synced in real time.

Web · two signature capabilities

The core value of building a project-level understanding platform.

The whole picture on one screen

Unified project space Vector drawings, remote-sensing imagery, terrain, survey data and monitoring data share one project-space foundation. Everything renders in one coordinate system — no more switching between software packages.

Real-time sensing, proactive warning

Dynamic monitoring and alerts Multi-sensor real-time connection, automatic acquisition and ingestion, multi-level threshold alerts pushed via SMS / email / in-site message. Anomalies sync to mobile for re-survey, with trackable, closable status.

The field team's pocket tool

Anomalies found and delineated on desktop sync instantly to the phone — anomaly re-survey, field notes, navigation and offline work, ready to use on arrival.

The field team's pocket tool

DIGspot field app: anomaly details, map positioning and field records

Actual product UI · DIGspot mobile (anomaly list / map navigation / re-survey records / field photos)

01

Anomalies in your pocket

02

Re-survey & verify

03

Field acquisition

04

Navigation

Six core functions

From receiving an anomaly task to completing field verification — the whole chain is done on the phone.

Anomaly list and search

View anomalies by project, type and status with search and filters — pending re-survey tasks are immediately visible.

Re-survey and verification records

Fill in re-survey results and verification conclusions on site, update anomaly status, with records linked directly to the corresponding anomaly.

Photo / video capture

Field photos and videos upload instantly and are archived together with anomaly locations and re-survey records.

Anomaly creation and editing

New field findings can be created as anomalies on the spot with attributes added there and then — no clue is missed.

Map positioning and navigation

Anomaly positions appear on the map with one-click navigation to the target — no paper point maps in the field.

Offline mode · automatic sync

With no network on site, data is stored locally and syncs automatically once connectivity returns — no lost records, no duplicate entry.

From watching data to managing issues

An anomaly is not a circle on a screenshot — it is a trackable object with status, owner and field evidence.

  1. 🖥️
    Professional analysis
    Delineating anomalies on desktop
  2. 🔔
    Sync and dispatch
    Anomalies sync to the app instantly
  3. 🧭
    Field verification
    Navigate to site · photo records
  4. 🔄
    Status update
    Re-survey conclusions reported back to the platform

Monitoring equipment deployed in the field

Automatic acquisition, unattended, running 24/7. Acquisition, transmission and power supply in one unit; with solar power it runs long-term as soon as it is deployed on site.

Monitoring equipment deployed in the field

DIGspace edge monitoring equipment deployed on site

Field monitoring equipment deployed on site · integrated acquisition / transmission / power supply

01

Multi-source instrument connection

02

Automated acquisition

03

Unattended

04

Reliable transmission

Six core capabilities

From the field onward, data keeps flowing into DIGspace.

Multi-source instrument connection

Supports ERT and microtremor plus sensor devices such as GNSS, water-level and rainfall gauges — plug and play, auto-recognized.

Automatic acquisition · edge preprocessing

Acquisition runs automatically on schedule, preprocessing is completed on site, and uploaded data goes straight into the cloud inversion flow.

Resumable transfer · local caching

Data is cached locally during outages and resumes automatically afterwards — nothing is lost on poor field networks.

Unattended · 24/7 operation

Long-term unattended field operation with automatic reconnection; engineers focus on analysis instead of babysitting devices on site.

Remote status monitoring and configuration

Device online status, acquisition progress, battery and signal are visible remotely; acquisition tasks can be issued and configured from afar.

Low power · solar supplied

Low-power design with solar supply enables long-term standalone operation at sites without grid power.

Four-end collaboration closes the online-monitoring loop

From field acquisition to deep analysis, from alert generation to field re-survey — edge, cloud, web, mobile and desktop work together, turning online monitoring from "watching data" into "handling issues".

Monitor → early warning → re-survey → analyze → act

Edge acquisition → automatic cloud inversion → anomaly detection → alert generation → field re-survey feedback → expert interpretation — every step runs on one data set, eliminating repeated exports and version drift.

  1. 📡
    Automated acquisition
    Edge · unattended operation
  2. ☁️
    Automated inversion
    Cloud processing · time-series ingestion
  3. 🎯
    Detect anomaly
    Threshold rules · automatic delineation
  4. 🔔
    Generate alert
    Multi-channel push
  5. 📱
    Field re-survey
    Mobile navigation and photo records
  6. 🖥️
    In-depth interpretation
    3D review on desktop
  7. 🛠️
    Action assignment
    Continue to re-survey / processing
  8. ✅
    Close and archive
    Status reporting · results retained

Four-end architecture · data stored only once

One data foundation, four working scenarios — continuous edge acquisition, collaborative web management, field re-survey on mobile and in-depth desktop interpretation; data flows seamlessly across all four ends.

End-to-end data lineage

Device → task → data → processing → results → anomaly → alert — every step is traceable.

Alerts drive in-depth review

Web alert → locate data on desktop → in-depth review → write conclusions back to the anomaly record.

Unified accounts & permissions

One account across all four ends, customizable roles and permissions granted per project / data set.

Three core advantages

From offline data processing to a closed online-monitoring loop, from people hunting anomalies to the system surfacing them proactively — this is the fundamental difference between DIGspace and traditional geophysics software.

Truly unattended operation

Online 24/7 Remote device management, scheduled automated acquisition, and automated cloud processing — routine monitoring runs end to end without manual intervention, so engineers focus on analysis, not site visits.

Closed-loop anomaly tracking

More than just detection Anomalies are detected automatically and tracked through their full lifecycle — found, confirmed, re-surveyed, verified, closed — with a fully auditable handling process: from static snapshots to closed-loop management.

Four ends, each doing what it does best

A complete loop across four ends Continuous edge acquisition, collaborative web management, field re-survey on mobile, in-depth desktop interpretation. On one data foundation, alerts drive review and conclusions are written back and archived.

Turning deliverables from handcraft into standardized products

Reports are the translation layer between data and decision-makers — clients may not read color scales, but they read engineering conclusions.

From images to engineering language

The plugin framework translates resistivity into moisture content and anomaly zones into phreatic lines — data is delivered in a form decision-makers can use, with every conclusion traceable to the original results.

From days of work to one click

Generate engineering reports in one click, freeing interpreters from screenshots, layout work and manual transcription; machine generation eliminates copy errors.

Unified format · comparable and archivable

One format across people and projects makes results directly comparable; standardized deliverables can be archived, searched and reused.

Analysis and monitoring on one platform

In-depth desktop interpretation, online web monitoring, and field re-survey on mobile — after requesting a trial, modules are enabled for the exploration methods you use, with onboarding guidance throughout.

Request a 30-day trialDownload the Windows client
Geomative

A provider of spatial intelligence technology and equipment, serving surveying, energy, transport and emergency response with fully self-developed hardware and software.

Products

  • Resistivity and IP Tomography
  • Electromagnetic
  • Integrated Well Logging System
  • Airborne and Ground Magnetometers
  • Geological Online Monitoring System

Industries

  • Mineral Resource Exploration
  • online monitoring
  • Cross‑hole investigation
  • Hydrogeological Survey
  • Engineering Geological Investigation
  • Underground Environmental Monitoring

Service & Support

  • Knowledge Base
  • FAQ
  • Document Downloads
  • Drivers & Software
  • Warranty Policy
  • Contact Support

copyright@2026 Shenzhen Geomative Technology Co., Ltd.

Privacy PolicyTerms of UseSitemap